Jump to content

Welcome to Smart Home Forum by FIBARO

Dear Guest,


as you can notice parts of Smart Home Forum by FIBARO is not available for you. You have to register in order to view all content and post in our community. Don't worry! Registration is a simple free process that requires minimal information for you to sign up. Become a part of of Smart Home Forum by FIBARO by creating an account.


As a member you can:

  •     Start new topics and reply to others
  •     Follow topics and users to get email updates
  •     Get your own profile page and make new friends
  •     Send personal messages
  •     ... and learn a lot about our system!


Regards,

Smart Home Forum by FIBARO Team


Clear Debug & Catching Errors 2.0

   (1 review)

1 Screenshot

About This File

I have noticed that sometime scenes or virtual devices stuck without any visible error. Another observation, that when it happens I cannot see debug information/messages of the scene/VD. In addition the Chrome browser crushes - Ah, Snap.

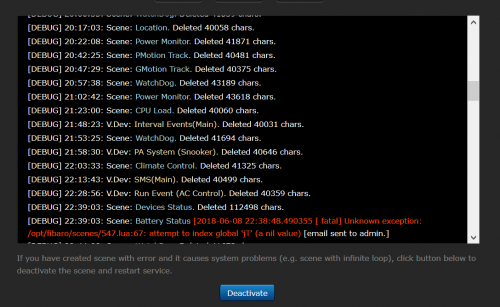
  1. The idea behind this scene is to monitor debug text of all scenes and virtual devices (including all buttons, sliders and etc.) in the system. In case the length of all messages over 40.000 characters, the scene clears the buffer.
  2. Since the code already reads debug messages, it checks the last message and if there is an error message (scene or virtual device) the code sends email to administrator with an error description.
    • Note: In case of error the messages are not deleted! The purpose of that is to keep the error for user review and debugging.
  3. Currently this scene runs every 300 sec. (5 minutes) . In order to set different time, please change sleepTime variable. (sleepTime = xxx)Capture.PNG.5a971fecd44b559615c1dffdd1d10b74.PNG
  4. By default scene clears debug buffer over 40.000 characters. In order to set different default length, please change txtLen variable. (txtLen = xxxxxx)
  5. In addition you have an option to set max. debug buffer length to any size for any scene or virtual device and its buttons. To do so please update  txtLenTbl table as follow:
    • Since the system could use same ID for VD and scene,  this table has two elements of arrays,  VD (vdLen)  and scene (sceneLen)
      •       
        local txtLenTbl = { 
                    vdLen = {{30000,"|618|615b12|515b3|"}, {35000,"|134|163b13|"} },                     
                sceneLen = {{35000,"|25|"},{30000,"|17|545|"} },
                          }
        --[[
        Vitual Device table elemnt:
        1st param. 30000 is the desired buffer length size.
        2nd param.  "|618|615b12|515b3|" is the list of VD ids and button number separated by "|". 
        For main loop use device ID only, for VD's button use button number same as in fibaro:call(VDid, "pressButton", button_num) function. 
        For example:
        618 - means Virtual device id 618 main loop.
        615b12 - means Virtual device id 615 button number 12.
        
        
        Scene table element:
        1st paraam. 35000 is the desired buffer length size.
        2nd param.  "|34|25|" is the list of scene ids separated by "|".
        
        You can defined as many arrays as needed.
        --]]


  6. The scene designed to run automatically, so please set "Max. running instances:"  to 3 and "Run scene:" to automatic.  Capture.PNG.9aa2d225c84db71e631cdd1aa4ba36c1.PNG. When the buffer cleared, the name of that scene/VD  will be displayed at scene's debug window.
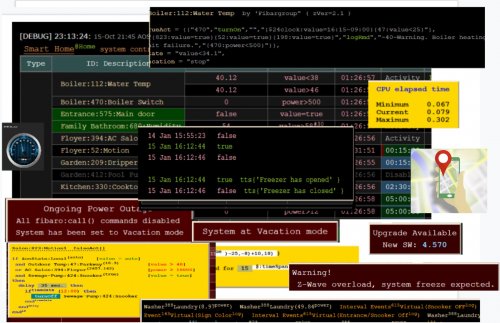
  7. This code should find all scenes and Virtual devices (including all buttons, sliders and etc.) at the system. To make sure that everything has found at your system, please press "Start" button Capture.PNG.aa4982cc3ca004bcd5526f55f3145d33.PNG to run second instance of scene. This "one-time" instance  will be executed without loop. Means only one instance of automatic loop could be exist. After second instance execution you should see on scene's debug window printout of every scene/VD/VD button. its current buffer length size and max. allowed buffer size.
  8. Since this code runs in my system I didn't get any stuck issues and has successfully caught few unexpected errors in the scenes and VDs.
  9. I don't know if it somehow related to system freeze problem, but since this code runs I don't have system freeze or any CPU overloads. Hope it helps...


What's New in Version 2.0   See changelog

Released

New improvements:

 added ignoreErr global variable to define devices/scenes on which error will be ignored and not reported.

ignoreErr = "|525|597|535b1|"

To define virtual device button, use <deviceID>b<button number>.

See example above "535b1". Ignore error in virtual device 535 button number 1.


User Feedback

Recommended Comments

Hi

Hello it is possible to delete the first line again and again.


api.delete(("/scenes/"..sceneID.."/debugMessages")[2])

Thank you i would like to thank you in advance your work is great.

Hi

Hello it is possible to delete the first line again and again.


api.delete(("/scenes/"..sceneID.."/debugMessages")[2])

Thank you i would like to thank you in advance your work is great.

Edited by parip69
Link to comment
Share on other sites

Yes, you can delete again and again.

By the way even if there is no line it works without any error.

Link to comment
Share on other sites

Hi

Hello I would like to let 11 lines always delete the oldest in the case the first line in the debug.


if (#api.get("/scenes/"..sceneID.."/debugMessages")) > 11 then
    api.delete(("/scenes/"..sceneID.."/debugMessages")[2])
end

Unfortunately, this does not work as I have illustrated below mine too. I want it to work like a ring buffer.

I want to leave 11 lines and delete the oldest man again and again.

Many Thanks.

Link to comment
Share on other sites

Guest cag014

Posted (edited)

Unfortunately I didn't find a way to delete part of message(it requires to use api.put() which sometimes does mess the system).

But may I suggest follow scenario, go to scene where you want to keep 11 lines and add follow code:

local msgs, mStr, lines2keep = "", "", 11

msgs = api.get("/scenes/" ..  __fibaroSceneId .. "/debugMessages")
if (#msgs > lines2keep) then
  api.delete("/scenes/" ..  __fibaroSceneId .. "/debugMessages")
  for i=-lines2keep,0 do
    mStr = mStr .. "<br>" .. os.date("[DEBUG] %H:%M:%S: ",msgs[#msgs+i].timestamp) .. msgs[#msgs+i].txt
  end
  fibaro:debug("Last " .. lines2keep).. " lines:" .. mStr)
end

By the way __fibaroSceneId is variable, which contains the ID of the scene by the system. No need to change it.

Edited by cag014
Link to comment
Share on other sites

I have this script along time but i don't now why but it does do everything but not the error scripting

i placed -- for my homeTable, it give a error script but it doesn't sows in this script annymore


is it because of the new firmware??

Link to comment
Share on other sites

Yes, in version 4.520 Fibaro has changed the error description format.

Please download the latest script.

Link to comment
Share on other sites

I tryied that already :) but got alot of strange code


{\rtf1\ansi\ansicpg1252\deff0\nouicompat{\fonttbl{\f0\fnil\fcharset0 Calibri;}{\f1\fnil\fcharset1 Cambria Math;}{\f2\fnil\fcharset1 Segoe UI Symbol;}{\f3\fnil\fcharset0 Cambria Math;}}
{\*\generator Riched20 10.0.17134}{\*\mmathPr\mmathFont1\mwrapIndent1440 }\viewkind4\uc1 
\pard\sl240\slmult1\f0\fs22\lang9 --[[\par
%% autostart \par
--]]\par
--[[\par


and things like this

u-10179?\u-9007?\f0 <


i tried to clean up but get error's (think deleted to much)


is there another download

Link to comment
Share on other sites

Guest cag014

Posted (edited)

Please download the file using WordPAd and then copy/paste

Edited by cag014
Link to comment
Share on other sites

dont have wordpad but Word from microsoft, works great

and again very nice script again, nice icon


thank scag014

ther is only one thing, dont know if the problem only acourse me but when the script starts ther is a massive increase in the cpu performense

Link to comment
Share on other sites

Guest cag014

Posted (edited)

@Kage

Have checked and I don't see any significant CPU increase.

Could you please, just for testing purpose,  to download CPU & RAM monitor and to run it with and without the script, just to see if the CPU average goes up.


1 hour ago, sonnyboy said:

@cag014
I use WordPad and still got the same promblem.

Do you see the code correctly in WordPad? if yes, just copy the text and copy to scene

Edited by cag014
Link to comment
Share on other sites

I did 

Every two minuten it spike to 70 to 55% cpu for x sec en drops back to 11% ram doesnt change. If i stop the script it is Just 4 to 15 %

Link to comment
Share on other sites

Strange, I don't see such a change on CPU!!

Did you see  this spikes on CPU&RAM script debug window? What about changes on average CPU load?

Link to comment
Share on other sites

First Happy New Year :)


I have made a screenJPG so you can see and set the timer at 60 sec

This is only in CPU no changes in RAM

cleardebug.jpg

Link to comment
Share on other sites

Usually when you start any scene the CPU goes high, but after a while it goes back to normal performance.

Could you post CPU load for few minutes ( when the scene is running)

Here is mine load

Capture.thumb.PNG.426bcfbfc4b47e00fa1a135cc2999af2.PNG

Link to comment
Share on other sites

ID=2 this is administrator of the system, since I don't know what other users exist in the system, I'm using the default.

You can change the eMailId to any other users in the system, please make sure this user has correct email address

Link to comment
Share on other sites

I had this scene enabled and as I was monitoring the system for a long time, I had cpu spikes up to 50% and sometimes 90% and after I disabled it cpu usage went down to normal so there is definitely room for tweaking and improving. 

Link to comment
Share on other sites

Guest cag014

Posted (edited)

Didn't find any special spikes that related to this scene.

What is your setup for sleepTime ? usually it is 120 seconds.

So by default this scene sleeps over 2 minutes and runs for few seconds. (depends on your system configuration)

This scene always runs in my system... no special issues.

By the way any scene on startup drives CPU resources. This scene heavily uses api.get() functions, so some spikes expected on start of scanning.

You can test it  easily.. place two screens (scene and CPU ) see picture below.

Run any scene and monitor CPU, you'll see spike.

Spoiler

Capture.thumb.PNG.b61131320e3699e4e9729062e2df5fd0.PNG

But to be on safe side, could you please post you CPU graph with and without debug messages?

Please do not switch windows during the monitor period of time. Just by switching windows in browser when you back to CPU window it jumps over 100%

I believe with debug scene we should see some spikes every 2 minutes only.


Edited by cag014
Link to comment
Share on other sites

Thank you for the example. Indeed I started with using api.put(msgs) but nothing happpened. Luckily the system wasn't messed either.

In your proposal I ran into problems adding new debug messages afterwards. Therefore, instead of composing one large msgs string I now print it immedeately.

Also, one line too many was preserved. I boiled it down to this simple function that can be put into any script:

function limitDebugMessages(MaxMessages)
local debugVar="/scenes/" .. __fibaroSceneId .. "/debugMessages"
local s
local i

if (MaxMessages == nil)
then
	MaxMessages=200
end
if (table.maxn(api.get(debugVar)) > MaxMessages) --max debug lines
then
	s=api.get(debugVar)
	api.delete(debugVar)
	for i=1-MaxMessages,0 do
		print(os.date("[DEBUG] %H:%M:%S: ",s[#s+i].timestamp) .. s[#s+i].txt.. "<br>")
		end
end
end
Link to comment
Share on other sites

Join the conversation

You can post now and register later. If you have an account, sign in now to post with your account.

Guest
Add a comment...

×   Pasted as rich text.   Paste as plain text instead

  Only 75 emoji are allowed.

×   Your link has been automatically embedded.   Display as a link instead

×   Your previous content has been restored.   Clear editor

×   You cannot paste images directly. Upload or insert images from URL.

×
×
  • Create New...