Welcome to Smart Home Forum by FIBARO
Dear Guest,
as you can notice parts of Smart Home Forum by FIBARO is not available for you. You have to register in order to view all content and post in our community. Don't worry! Registration is a simple free process that requires minimal information for you to sign up. Become a part of of Smart Home Forum by FIBARO by creating an account.
As a member you can:
- Start new topics and reply to others
- Follow topics and users to get email updates
- Get your own profile page and make new friends
- Send personal messages
- ... and learn a lot about our system!
Regards,
Smart Home Forum by FIBARO Team
Search the Community
Showing results for tags 'air quality data'.
Found 6 results
-
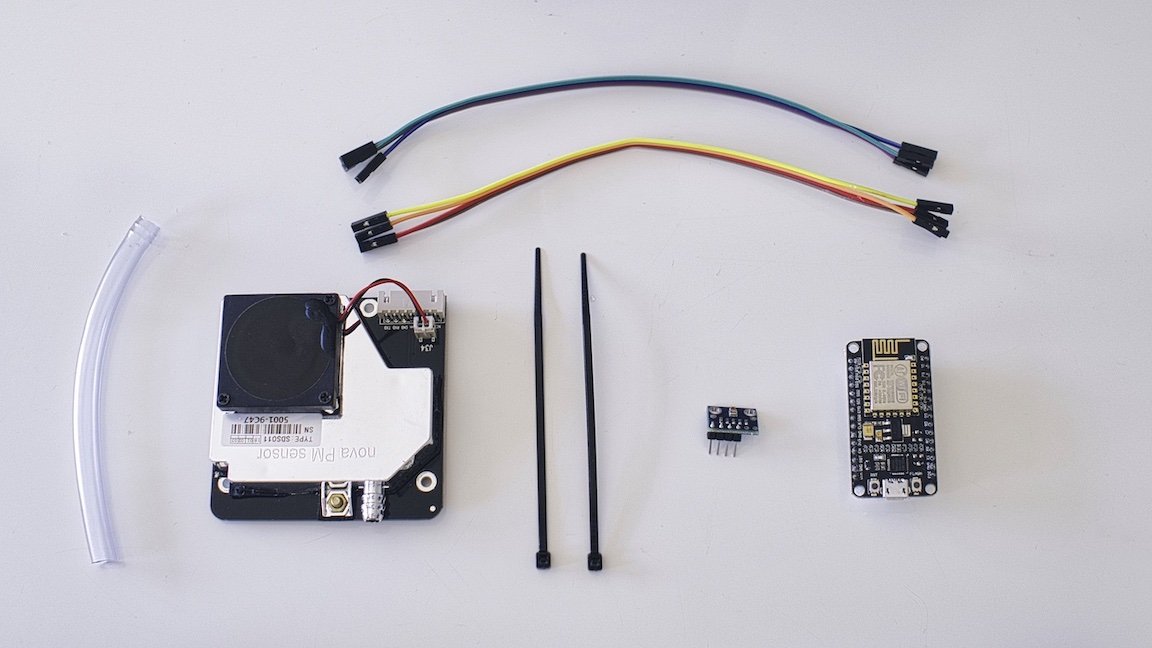
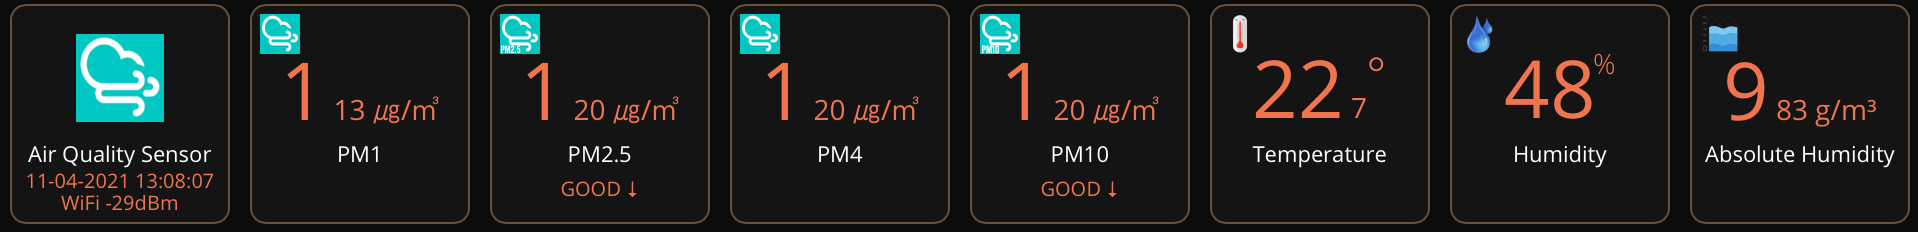
This QuickApp reads the PM1, PM2.5, PM4, PM10, Temperature, Humidity and Air Pressure (and calculated absolute Humidity) values directly from a sensor. With this sensor you can measure air quality yourself. This QuickApp will send notifications when PM2.5 or PM10 readings reach a breakpoint. The Air Quality sensor is a DIY setup for less than 50 euro. It is very easy to assemble and ready to make kits are available, see also https://sensor.community/en/sensors/airrohr/ for more info. You can order seperate items from for example AliExpress for the lowest prices, or order a complete set from: https://nettigo.eu/products/sensor-community-kit-sds011-bme280-english-language or https://www.tinytronics.nl/shop/nl/luchtwachters-delft-maak-zelf-een-fijnstofmeter-workshop-kit The Air Quality Sensor has a WiFi interface and Application Programming Interface (API). This QuickApp uses the API to get the measurements available to the Fibaro Homecenter. Changes version 1.2 (11th April 2021) Added support (child devices) for PM1 and PM4 levels (Plantower and Sensirion sensors) Added support for BMP280 sensor Changes version 1.1 (31th Januari 2021) Added support for Plantower Air Quality Sensor (for now without PM1.0) Added Airpressuretext to log of Child Device Airpressure Added Quickapp variable for debug level (1=some, 2=few, 3=all). Recommended default value is 1. Removed QuickApp Variable bme280Sensor (no need for that anymore, works without it) Removed QuickApp Variable path (is now fixed) Changes version 1.0 (23rd January 2021) Added Child Device for Absolute Humidity Added "Refresh" button Changes version 0.5 (23rd October) With the new firmware and API function, solved a small bug in presenting WiFi dBm Changed humidity and air pressure values to zero decimals Added air pressure unit text "hPa" Changed the master device to "Generic Device" Added QuickApp Variable for user defined icon master device Solved a bug preventing creation of QuickApp Variable bme280Sensor Changes version 0.4 (17th October 2020) Added support for BME280 sensor (temperature, humidity and air pressure) Added QuickApp Variable bme280Sensor (true or false) to indicate the presence of a BME280 sensor otherwise a DHT22 sensor is assumed Reduced the amount of labels, now only one label Removed the firmware version from the log under the icon Changes version 0.3 Error message instead of debug message in case of an error Changed method of adding QuickApp variables, so they can be edited Added network error to log (under icon) Changes version 0.2 Changed label6 from "age" to time of the measurement Added automatic creation of child devices for Temperature, Humidity, PM2.5 and PM10 (with great help from @jgab from forum.fibaro.com) Added the value (Temperature, Humidity, PM2.5 and PM10) to the child devices, This can be used in, for instance, extra scenes and shows in the mobile app and dashboard. Added a short text of the air quality (GOOD, SATISFACTORY, etc.) to the icons in the dashboard (with great help of @petergebruers and @10der from forum.fibaro.com) Added the trend (up, down, equal) to the sort text of the air quality My configuration of the DIY air quality sensor: Nova SDS011 air quality sensor NodeMCU ESP8266 V2 opensource WiFi board BME280 temperature, humidity and air pressure sensor See how to simply assemble the air quality sensor yourself: https://sensor.community/en/sensors/airrohr/ See for general informatie about the Air Quality Sensor: https://luftdaten.info See for a map of measurements: https://sensor.community/en/ See for CVS files: https://archive.luftdaten.info See for sources: https://github.com/opendata-stuttgart/ QuickApp variables (mandatory, they will be automatically added with the default values): IPaddress = IP address of your sensor Path = Path behind the IP address, normally /data.json Interval = Number in seconds, the sensor normally is updated every 145 seconds UserID = User id to notify of PM2.5 / PM10 breakpoints bme280Sensor = Use of BME280 temperature, humidity and air pressure sensor, true or false PM2.5 breakpoints 0 - 30 GOOD (Minimal) 31 - 60 SATISFACTORY (Minor breathing discomfort to sensitive people) 61 - 90 MODERATELY POLLUTED Breathing discomfort to asthma patients, elderly and children 91 - 120 POOR (Breathing discomfort to all) 121 - 250 VERY POOR (Respiratory illness on prolonged exposure) 250+ SEVERE (Health impact even on light physical work. Serious impact on people with heart/lung disease) PM10 breakpoints 0 - 50 GOOD (Minimal) 51 - 100 SATISFACTORY (Minor breathing discomport to sensitive people) 101 - 250 MODERATELY POLLUTED Breathing discomfoort to asthma patients, elderly and children 251 - 350 POOR (Breathing discomfort to all) 351 - 430 VERY POOR (Respiratory illness on prolonged exposure) 430+ SEVERE (Health impact even on light physical work. Serious impact on people with heart/lung disease) Download the QuickApp here (download the file and un-zip): https://github.com/GitHub4Eddy/air_quality_sensor/archive/refs/tags/Air_Quality_Sensor_12.zip Or Fibaro Marketplace: https://marketplace.fibaro.com/items/air-quality-sensor How to install: Open the Configuration Interface Go to Settings > Devices Click + Choose Other Device Choose Upload File Choose file from your computer with .fqa


-
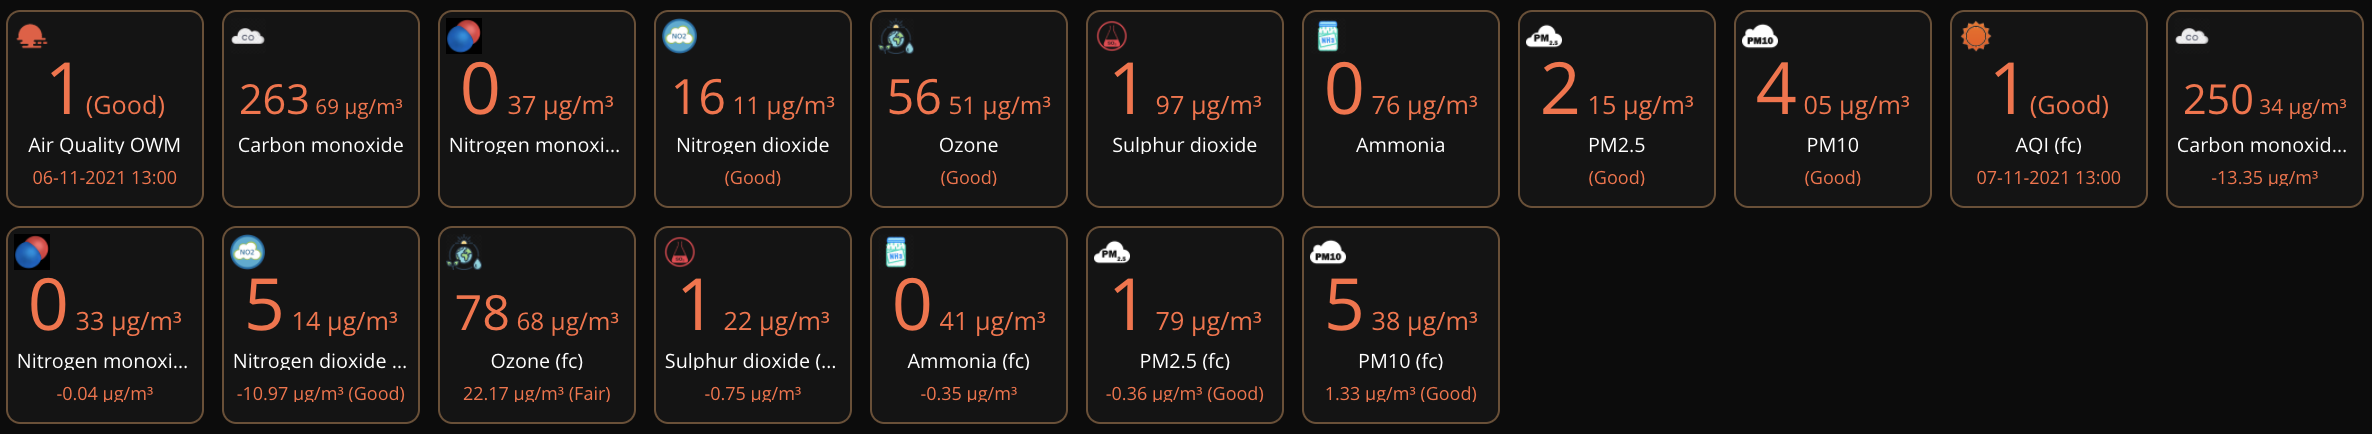
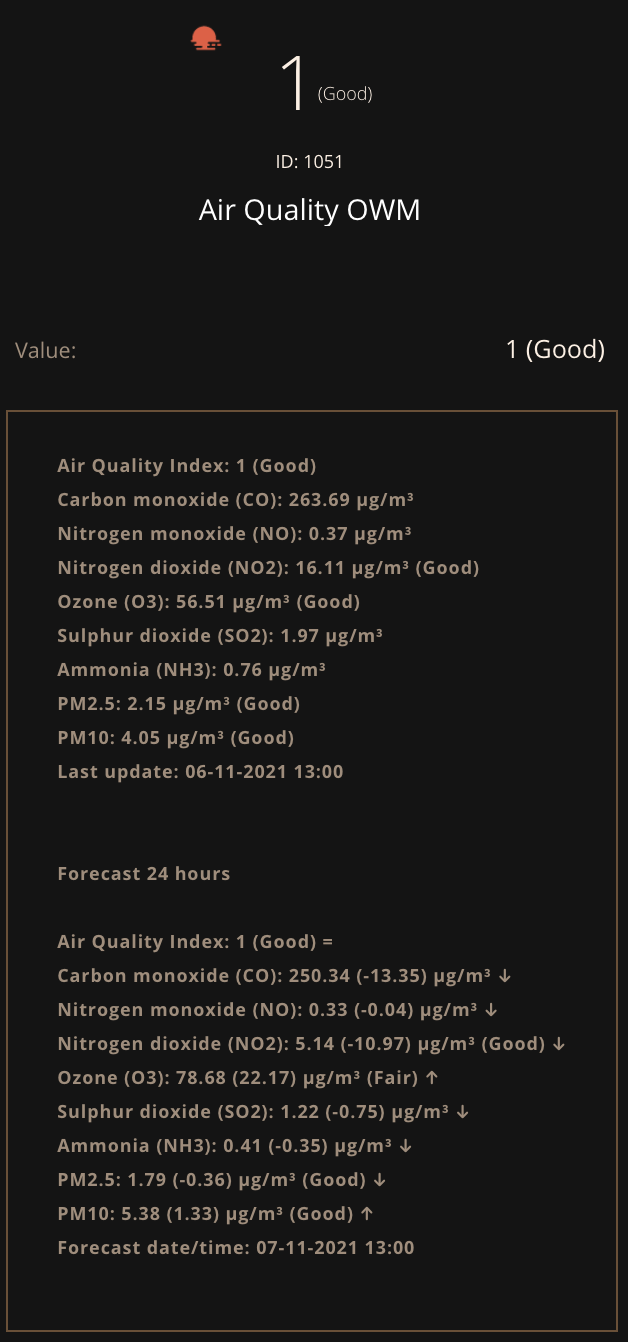
The QuickApp Air Quality OpenWeatherMap provides the current and forecast measurements for your location on Air Quality. Besides basic Air Quality Index the QuickApp provides also data about polluting gases such as Carbon monoxide (CO), Nitrogen monoxide (NO), Nitrogen dioxide (NO2), Ozone (O3), Sulphur dioxide (SO2), Ammonia (NH3), and particulates (PM2.5 and PM10). This QuickApp has Child Devices for Carbon monoxide (CO), Nitrogen monoxide (NO), Nitrogen dioxide (NO2), Ozone (O3), Sulphur dioxide (SO2), Ammonia (NH3), PM2.5 and PM10 for current measurement. This QuickApp has also Child Devices for Air Quality Index, Carbon monoxide (CO), Nitrogen monoxide (NO), Nitrogen dioxide (NO2), Ozone (O3), Sulphur dioxide (SO2), Ammonia (NH3), PM2.5 and PM10 for forecast measurement. This QuickApp has Child Devices for Carbon monoxide (CO), Nitrogen monoxide (NO), Nitrogen dioxide (NO2), Ozone (O3), Sulphur dioxide (SO2), Ammonia (NH3), PM2.5 and PM10. Common Air Quality Index (CAQI) The Common Air Quality Index (CAQI) is an air quality index used in Europe since 2006. In November 2017, the European Environment Agency announced the European Air Quality Index (EAQI) and started encouraging its use on websites and for other ways of informing the public about air quality. As of 2012, the EU-supported project CiteairII argued that the CAQI had been evaluated on a "large set" of data, and described the CAQI's motivation and definition. CiteairII stated that having an air quality index that would be easy to present to the general public was a major motivation, leaving aside the more complex question of a health-based index, which would require, for example, effects of combined levels of different pollutants. The main aim of the CAQI was to have an index that would encourage wide comparison across the EU, without replacing local indices. CiteairII stated that the "main goal of the CAQI is not to warn people for possible adverse health effects of poor air quality but to attract their attention to urban air pollution and its main source (traffic) and help them decrease their exposure." The CAQI is a number on a scale from 1 to 100, where a low value means good air quality and a high value means bad air quality. The index is defined in both hourly and daily versions, and separately near roads (a "roadside" or "traffic" index) or away from roads (a "background" index). As of 2012, the CAQI had two mandatory components for the roadside index, NO2 and PM10, and three mandatory components for the background index, NO2, PM10 and O3. It also included optional pollutants PM2.5, CO and SO2. A "sub-index" is calculated for each of the mandatory (and optional if available) components. The CAQI is defined as the sub-index that represents the worst quality among those components. Here is a description of Air Quality index levels Pollutant concentration in μg/m3: Index NO2 PM10 O3 PM25 (optional) Good 1 0-50 0-25 0-60 0-15 Fair 2 50-100 25-50 60-120 15-30 Moderate 3 100-200 50-90 120-180 30-55 Poor 4 200-400 90-180 180-240 55-110 Very Poor 5 >400 >180 >240 >110 See more on CAQI: https://en.wikipedia.org/wiki/Air_quality_index IMPORTANT You need an API key from https://home.openweathermap.org The API is free up to 60 calls per minute Version 1.1 (10th November 2022) Added extra check for partly empty response ("coord" not empty but "list" is empty) Added extra message to the labels and de log text if there is no response Warning added in case the "forecast measurements" are not available Version 1.0 (7th November 2021) Added forecast measurements with hours you want your forecast. The forecast is shown in child devices and labels for all measurements. Version 0.1 (9th October 2021) Initial version Variables (mandatory): apiKey = Get your free API key from https://home.openweathermap.org latitude = latitude of your location (Default is the latitude of your HC3) longitude = longitude of your location (Default is the longitude of your HC3) interval = [number] in seconds time to get the data from the API timeout = [number] in seconds for http timeout debugLevel = Number (1=some, 2=few, 3=all, 4=simulation mode) (default = 1) Download the QuickApp here (download the file and un-zip): https://github.com/GitHub4Eddy/air_quality_openweathermap/archive/refs/tags/air_quality_owm-11.zip or from the Fibaro Marketplace: https://marketplace.fibaro.com/items/air-quality-openweathermap How to install: Open the Configuration Interface Go to Settings > Devices Click + Choose Other Device Choose Upload File Choose file from your computer with .fqa


- 18 replies
-
- 6
-

-

-
- air quality data
- air quality
- (and 3 more)
-
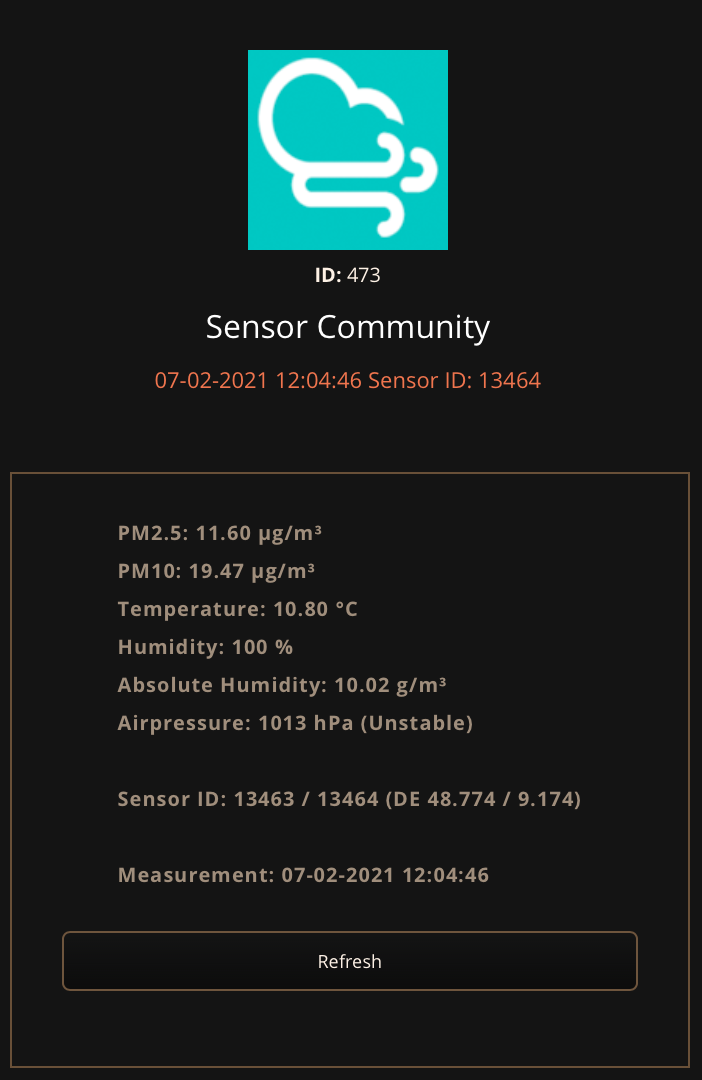
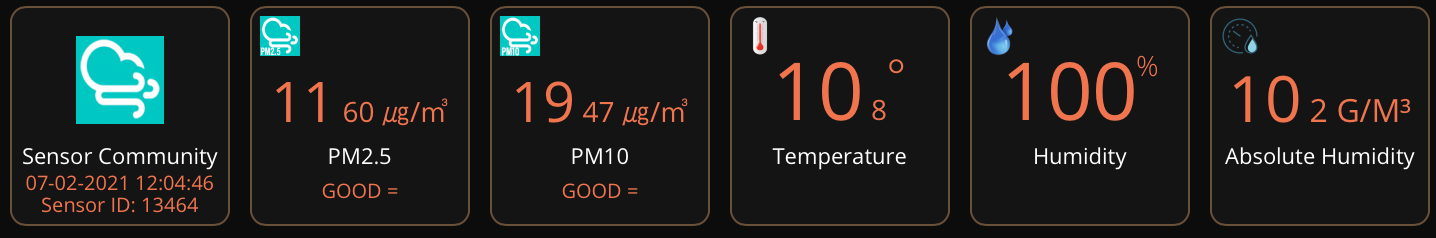
 This QuickApp reads the PM2.5, PM10, Temperature, Humidity and Airpressure values directly from a sensor somewhere in this world That sensor doesn't have to be your own sensor, any sensor can be used, just find one in your neighborhood For locating the sensor(ID's) in your neighborhood see: https://sensor.community/en/ Select two (!) SensorID's, one for PM2.5 and PM10 values and one for Temperature, Humidity and Airpressure values The PM2.5, PM10, Temperature, Humidity, Absolute Humidity and Airpressure readings are stored in the value of six (child) devices, so you can read the value from your own scenes This QuickApp will send notifications when PM2.5 or PM10 readings reach a breakpoint (if userID ~= 0) Absolute humidity is the measure of water vapor (moisture) in the air, regardless of temperature. It is expressed as grams of moisture per cubic meter of air (g/m3) See also https://luftdaten.info See also for CVS files: https://archive.luftdaten.info See also https://github.com/opendata-stuttgart/ API documentation: https://github.com/opendata-stuttgart/meta/wiki/EN-APIs QuickApp variables (mandatory, they will be automatically added with the default values): sensorID1 = [number] SensorID for PM2.5 and PM10 values, your own sensor or from someone else, 13463 is an example sensorID2 = [number] SensorID for Temperature, Humidity and Airpressure values, your own sensor or from someone else, 13464 is an example interval = [number] in seconds time to get the sensor data from sensor.community timeout = [number] in seconds for http timeout userID = [number] userID to notify of PM2.5 / PM10 breakpoints debugLevel = [number] Debug logging (1=some, 2=few, 3=all) (default = 1) icon = [numbber] User defined icon number (add the icon via an other device and lookup the number) Version 1.0 (7th February 2021) Added Child Devices for Temperature, Humidity, Absolute Humidity and Airpressure Changed the quickapp variable SensorID to two variables, one for PM values and one for Temperature, Humidity and Airpressure values Added Quickapp variable for debug level (1=some, 2=few, 3=all). Recommended default value is 1. Added QuickApp Variable for user defined icon master device-- Added Airpressure Text in log of Airpressure Child Device Removed QuickApp Variable address, there was no need to change it by user Added values for Temperature, Humidity, Absolute Humidity and Airpressure to the lables Added values for Country, Latitude and Longitude to the labels Added Sensor ID to the log below the value Added "Refresh" button Added extra check for empty data return from Sensor Community Version 0.4 (19th August 2020] Added child devices for PM2.5 and PM10 Added time of measurement, adjusted to your timezone Added Timeout QuickApp variable with high http timeout value to prevent errors Error message instead off debug message in case of an error Changed method of adding QuickApp variables, so they can be edited Version 0.3 (15th June 2020) Link to CVS files added in comment Fixed some typos Fixed breakpoint check 0 - 30 and 0 - 50 notifications Fixed retrieve of json data Version 0.2 (14th June 2020) Link to API documentation added Solved bug / crash: Better selection of the first part of the apiResult Changed some debugging logica Added UserID (mandatory) for sending push notifications Added push notifications based on the PM2.5 and PM10 breakpoints Solved bud / crash if there only was one reading from the api, most of the time there are two readings (last 5 minutes) Version 0.1 (13th June 2020) Initial version Suggestions are welcome. If someone feels the need to improve the QuickApp, you are very welcome. Download the QuickApp here (download the file and un-zip): https://github.com/GitHub4Eddy/sensor_community/archive/sensor_community_1.zip or Fibaro Marketplace: https://marketplace.fibaro.com/items/sensor-community How to install: Open the Configuration Interface Go to Settings > Devices Click + Choose Other Device Choose Upload File Choose file from your computer with .fqa

-
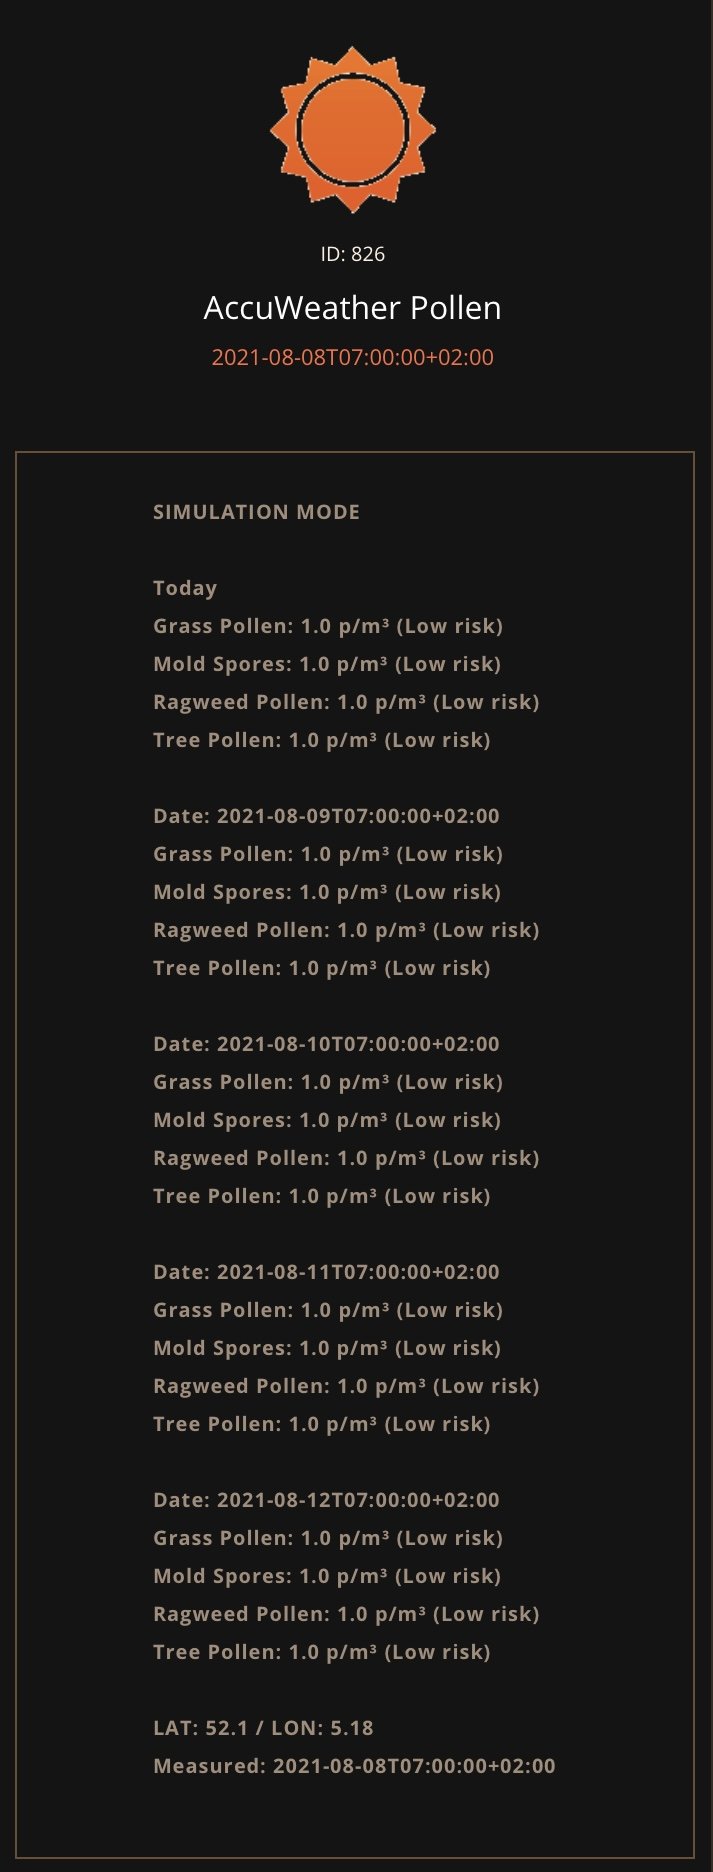
This QuickApp gives access to real-time and 5-day forecast pollen count and risk category for grass pollen, mold spores, ragweed pollen and tree pollen of any location from AccuWeather.com Pollen is a fine powder produced by trees and plants Pollen can severely affect people, especially those with different ailments such as asthma and respiratory issues. It can aggravate these existing conditions or cause these issues in high risk groups Grass Pollen: Pollen grains from grasses Mold Spores: The fungus produces spores that can become airborne Radweed Pollen: Ragweeds are annual and perennial herbs and shrubs. A single plant may produce about a billion grains of pollen per season. Tree Pollen: Pollen from trees such as Birch and Oak The QuickApp provides a risk evaluation with levels in particles/m³ Grass Pollen Risk Begin Range End Range Low 0 4.99 Moderate 5 19.99 High 20 199.99 Very High 200 299.99 Extreme 300 1000000 Mold Spores Risk Begin Range End Range Low 0 6499.99 Moderate 6500 12999.99 High 13000 49999.99 Very High 50000 64999.99 Extreme 65000 1000000 Ragweed Pollen Risk Begin Range End Range Low 0 9.99 Moderate 10 49.99 High 50 499.99 Very High 500 649.99 Extreme 650 1000000 Tree Pollen Risk Begin Range End Range Low 0 14.99 Moderate 15 89.99 High 90 1499.99 Very High 1500 2999.99 Extreme 3000 1000000 IMPORTANT You need an API key from https://developer.accuweather.com The API is free up to 50 API calls/day, one key Variables (mandatory): apiKey = Get your free API key from AccuWeather locationKey = AccuWeather number from your HC3 Lon/Lat interval = [number] in seconds time to get the data from the API timeout = [number] in seconds for http timeout debugLevel = Number (1=some, 2=few, 3=all, 4=simulation mode) (default = 1) icon = [numbber] User defined icon number (add the icon via an other device and lookup the number) ownload the QuickApp here (download the file and un-zip): https://github.com/GitHub4Eddy/accuweather_pollen/archive/refs/tags/accuweather_pollen-01.zip How to install: Open the Configuration Interface Go to Settings > Devices Click + Choose Other Device Choose Upload File Choose file from your computer with .fqa


-
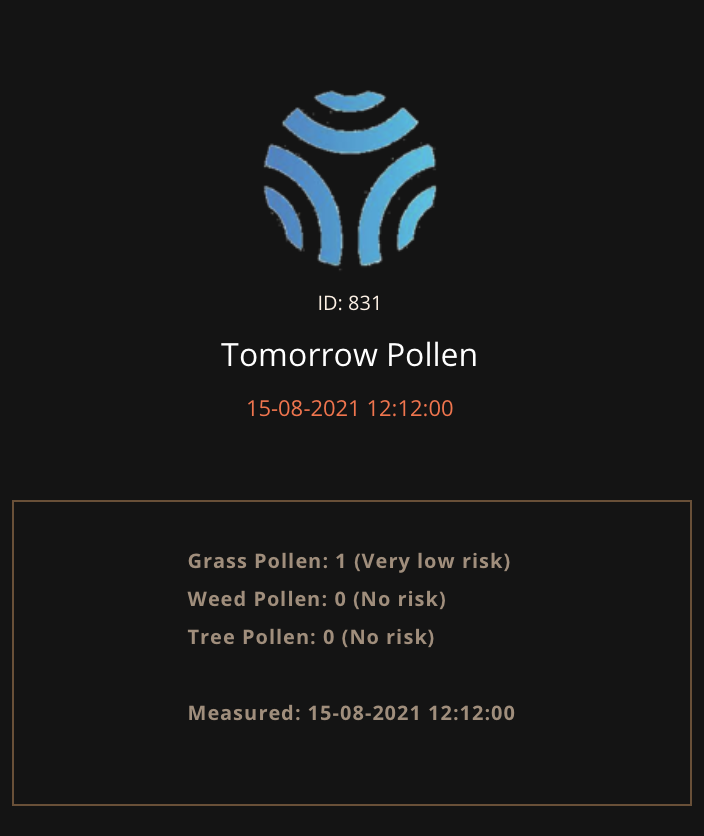
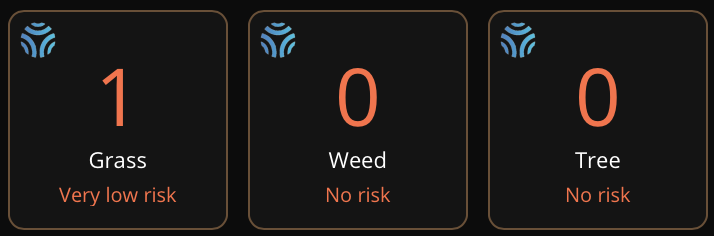
This QuickApp gives access to real-time pollen count and risk category for grass pollen, weed pollen and tree pollen of any location from Tomorrow.io Pollen is a fine powder produced by trees and plants Pollen can severely affect people, especially those with different ailments such as asthma and respiratory issues. Version 0.1 (15th August 2021) Initial working version Pollen: Grass Pollen: Pollen grains from grasses Weed Pollen: Weeds are annual and perennial herbs and shrubs. A single plant may produce about a billion grains of pollen per season. Tree Pollen: Pollen from trees such as Birch and Oak Risk: 0: None 1: Very low 2: Low 3: Medium 4: High 5: Very High IMPORTANT You need an API key from https://app.tomorrow.io The API is free up to 500 calls / per day, 25 calls / per hour, 3 calls / per second (Pollen is 5% of rate limit) You need to create your location in https://app.tomorrow.io/locations to get a location ID and copy it to the QuickApp variable Variables (mandatory): Variables (mandatory): apiKey = Get your free API key from Tomorrow.io location = Tomorrow.io location ID (created in https://app.tomorrow.io/locations) interval = [number] in seconds time to get the data from the API timeout = [number] in seconds for http timeout debugLevel = Number (1=some, 2=few, 3=all, 4=simulation mode) (default = 1) icon = [numbber] User defined icon number (add the icon via an other device and lookup the number) Download the QuickApp here (download the file and un-zip): https://github.com/GitHub4Eddy/Tomorrow.io_Pollen/archive/refs/tags/tomorrow_io_pollen-01.zip How to install: Open the Configuration Interface Go to Settings > Devices Click + Choose Other Device Choose Upload File Choose file from your computer with .fqa

-
Hi all, I tried to find similar topic, but without expected success. I'm wondering if it is possible to import the "OUTDOOR AIR QUALITY" indicator from NETATMO sensor to the LUA scene via API? Has anyone of you tried similar solution or maybe wrote a scene which can perform such action? Your advice would be much appreciated. Thanks