Welcome to Smart Home Forum by FIBARO
Dear Guest,
as you can notice parts of Smart Home Forum by FIBARO is not available for you. You have to register in order to view all content and post in our community. Don't worry! Registration is a simple free process that requires minimal information for you to sign up. Become a part of of Smart Home Forum by FIBARO by creating an account.
As a member you can:
- Start new topics and reply to others
- Follow topics and users to get email updates
- Get your own profile page and make new friends
- Send personal messages
- ... and learn a lot about our system!
Regards,
Smart Home Forum by FIBARO Team
Search the Community
Showing results for tags 'p1'.
Found 4 results
-
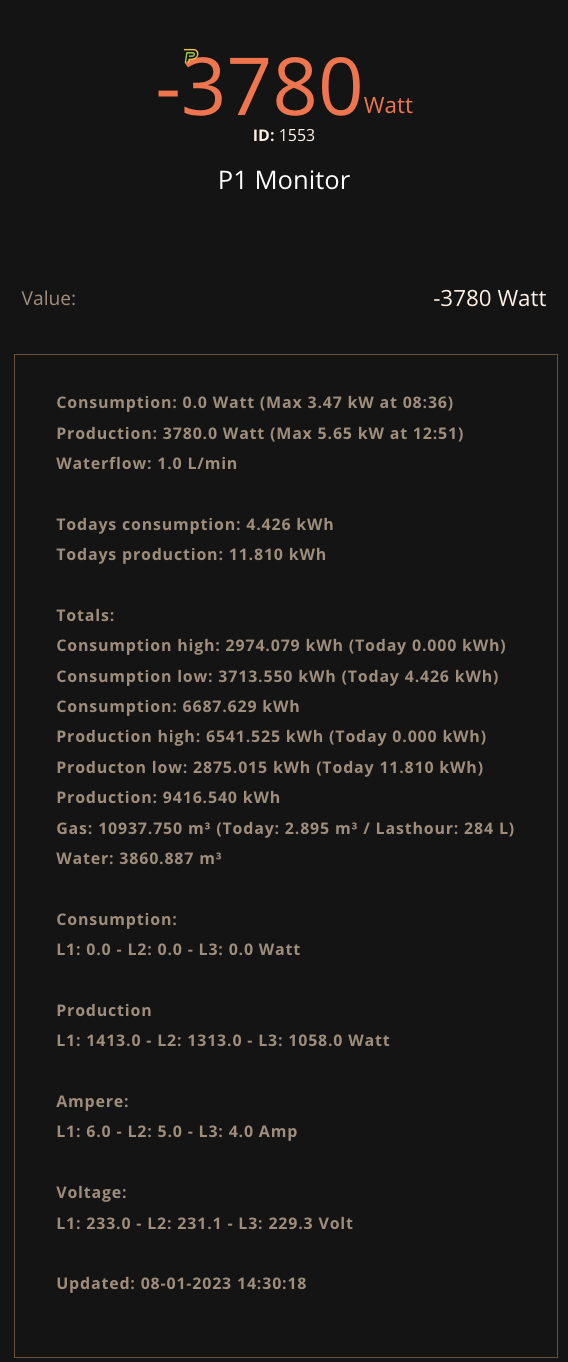
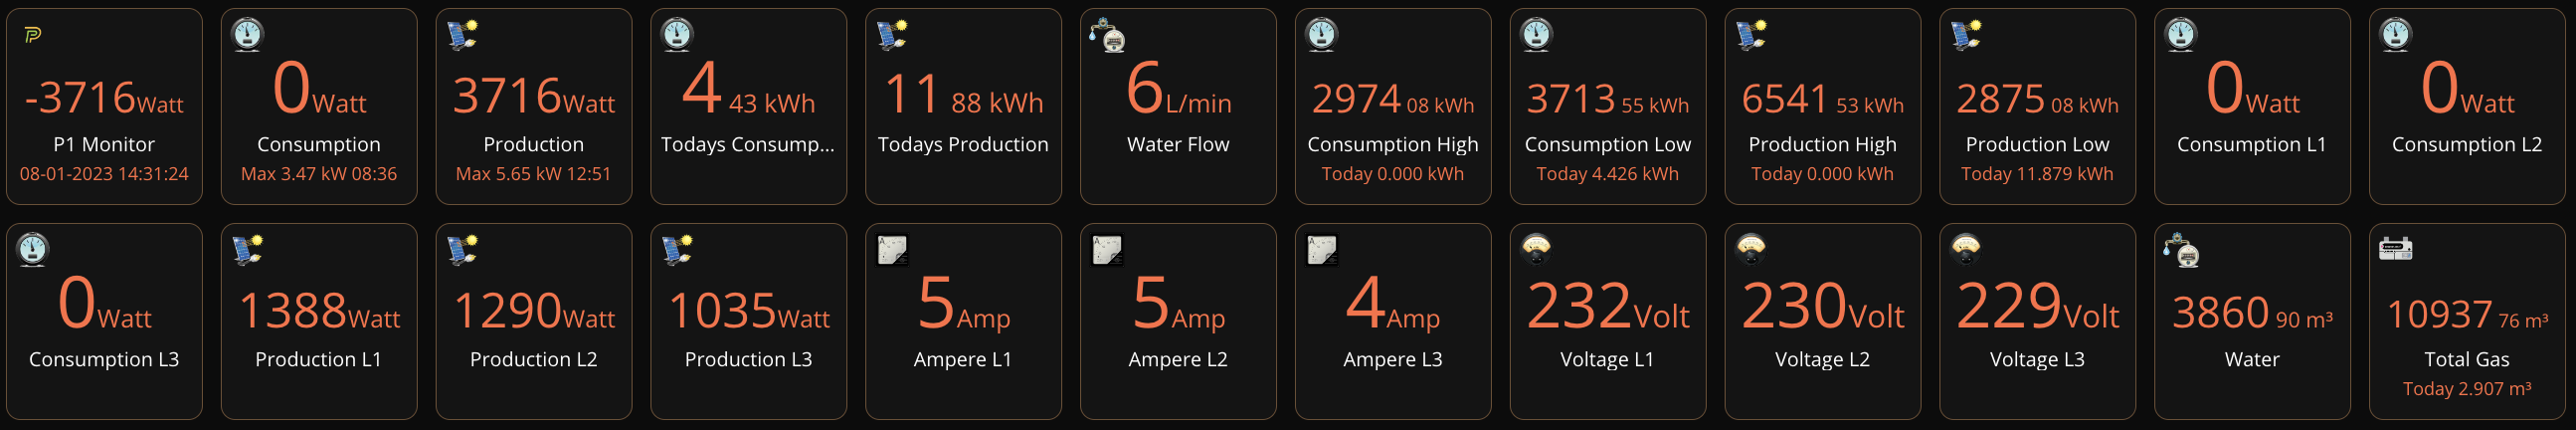
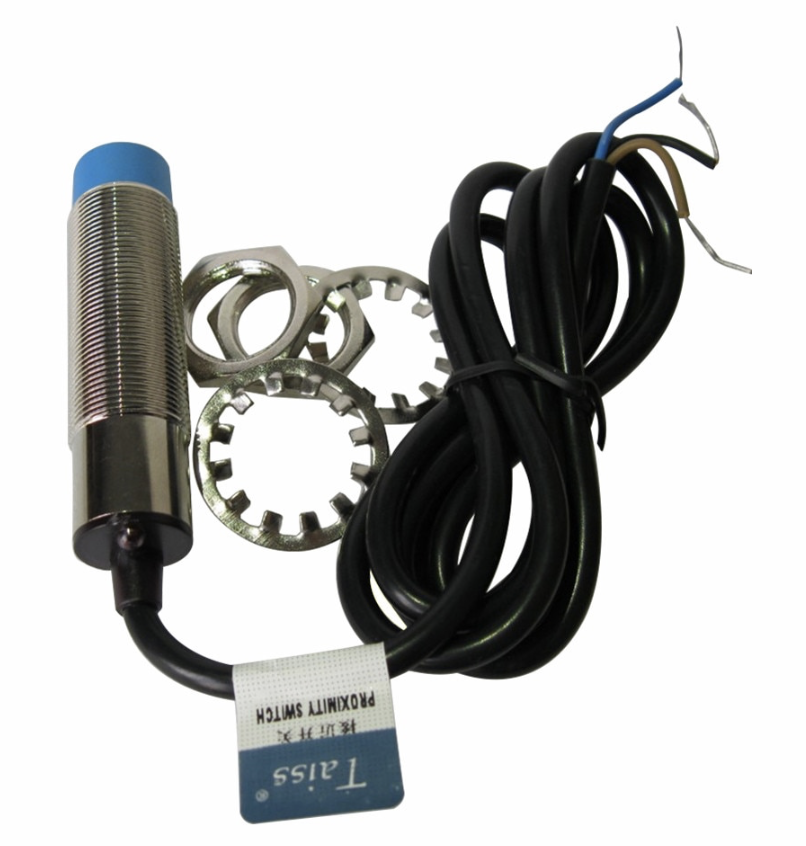
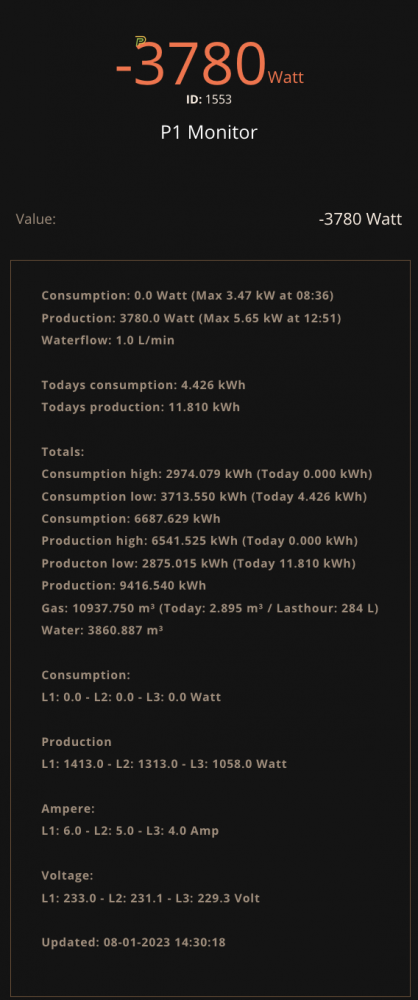
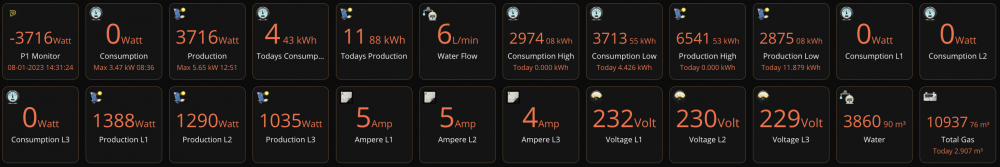
This Quickapp retrieves energy consumption, energy production, gas and water usage from the (P1 Monitor) energy, gas and water meter. This Quickapp uses the software of ztatz.nl to get the values from your smart energymeter. The ztatz plug-and-play software can run on a Raspberry Pi or in a Docker container. The Energy consumption and energy production are added to the HC3 energy panel. Use the child devices Todays Consumption and Todays Production to store energy data (kWh) in the Energy Panel. And use the child devices Consumption and Production for instantaneous power (Watt) in the Energy Panel calculations. Child Devices for: Consumption (Watt) (input for instantaneous power in Energy Panel calculations) Production (Watt) (input for instantaneous power in Energy Panel calculations) Todays Consumption (kWh) (input for energy panel) Todays Production (kWh) (input for energy panel) Waterflow (Liter) Consumption High (kWh) Consumption Low (kWh) Production High (kWh) Production Low (kWh) Consumption L1 (Watt) Consumption L2 (Watt) Consumption L3 (Watt) Production L1 (Watt) Production L2 (Watt) Production L3 (Watt) Ampere L1 (Amp) Ampere L2 (Amp) Ampere L3 (Amp) Voltage L1 (Volt) Voltage L2 (Volt) Voltage L3 (Volt) Total Gas (m³) Total Waterflow (m³) Interval: It is possible to process messages from the smart meter every second. Of course, this is only possible if the smart meter actually sends a message every second. This can be turned on via the ztatz software P1 port configuration page via the "maximum processing speed" option. Note that this gives a higher load on the Rpi (or Docker). It has been tested on the Rpi3/Rpi4 and works well on it. Older or other RPIs have not been tested. The P1 Monitor QuickApp uses 2 API calls each cycle, and if you also use Waterflow, 3 API calls each cycle. With an interval setting of 10 seconds there is an API call every 5 seconds (and with Waterflow enabled, every 3.33 seconds). So the fastest interval setting will probably be 3 seconds with Waterflow and 2 seconds without Waterflow. Ztatz software: https://www.ztatz.nl Docker container based on the ztatz.nl software: The container version has the same functionality as the full version for the Raspberry Pi. Docker container: https://hub.docker.com/r/mclaassen/p1mon I use a Raspberry Pi Smart Meter Cable Starter Kit Raspberry Pi 4 Model B Rev 1.1 2GB 32GB Micro SDHC Smart Meter cable P1 Monitor software from: https://www.ztatz.nl Water Flow Sensor (M18 8mm sensing DC 5V NPN NO LJ18A3-8-Z/BX-5V cylinder inductive proximity sensor switch work voltage 5VDC special for MCU) Version 2.0 (8th January 2023) Changed child device types for optimal support of the Energy Panel: kWh -> com.fibaro.energyMeter ampere/voltage -> com.fibaro.electricMeter Watt -> com.fibaro.powerMeter gas -> com.fibaro.gasMeter water -> com.fibaro.waterMeter Removed Power device calculation Removed child devices for gross consumption and device consumption Changed code to multi file Added for translations for English, French, Polish and Dutch Version 1.6 (8th January 2022) Changed the waterflow algoritme to show more stable and more acurate measurements Small change in the code for checking existance of waterflow sensor Changed the Waterflow unit from Liter to L/min Added experimental net consumption to power Added Lasthour gas to labels Changed the API request for status to json output Version 1.5 (4th September 2021) Support of new Energy Panel: Changed Child device Net Consumption to Main device with type com.fibaro.powerSensor (value can be positive or negative) Added Child device Todays Consumption to show the daily energy consumption in kWh Added Child device Todays Production to show the daily energy production in kWh Changed Child device Consumption High and Low to com.fibaro.energyMeter (kWh in property "value"; "rateType" = consumption). These values will be shown in the new energy panel. Changed Child device Production High and Low to com.fibaro.energyMeter (kWh in property "value"; "rateType" = production). These values will be shown in the new energy panel. Added automaticaly change rateType interface of Child device Consumption High and Low to "consumption" and Production High and Low to "production Changed Child device Consumption and Production to type com.fibaro.powerSensor (Watt) to show power graphs Changed Child device Consumption L1, L2 and L3 and Production L1, L2 and L3 to type com.fibaro.powerSensor (Watt) to show power graphs Additional changes: Added todays Maximum consumption and todays Maximum production and timestamp to the label text and Child device log text Added todays Maximum consumption and todays Maximum production automatic format measurement to W, Kw, MW or GW Added todays Consumption low and high (kWh) and todays Production low and high (kWh) to the label text and Child devices log text Added todays Consumption of gas in the label text and Child device log text Added Timestamp in format dd-mm-yyyy hh:mm:ss to log of Main device and labels Placed production below consumption in the labels Solved bug when Production is higher than Consumption with calculation of Gross Consumption (Gross Consumption = Net Consumption minus or plus Device Consumption) Version 1.4 (11th April 2021) Added Child Devices Waterflow and Total Waterflow Version 1.3 (13th February 2021) Added Child Devices for Voltage L1 L2 L3 Version 1.2 (6th February 2021) Added a lot of Child Device Version 1.1 (18th January 2021) Solved a bug when powerID = 0 Version 1.0 (15th Januari 2021) Changed routine te get Energy Device ID's fast (no more maxNodeID needed) Added "Update Devicelist" button to update the Energy devicelist Added Tarifcode High and Low (and empty for flat fee) Rounded Consumption and Production to zero digits Watt Added Quickapp variable for debug level (1=some, 2=few, 3=all). Recommended default value is 1. Re-aranged the labels Cleaned up some code Version 0.3 (16th August 2020) Added Quickapp variables for easy configuration Added Power Production Changed method of adding QuickApp variables, so they can be edited Tested on P1 Monitor version: 20221105 V2.1.0 Raspberry Pi model: Raspberry Pi 4 Model B Rev 1.1 Linux-5.15.74-v7l+-armv7l-with-glibc2.31 Python version: 3.9.2 QuickApp variables (mandatory, they will be automatically added with the default values): IPaddress = IP address of your P1 monitor interval = Number in seconds, the P1 Monitor normally is updated every 10 seconds, sometimes even faster debugLevel = Number (1=some, 2=few, 3=all) (default = 1) waterMeter = Existance of watermeter true or false (default = false) language = Preferred language (default = en) (supported languages are Engish (en), French (fr), Polish (pl) and Dutch (nl)) Download the QuickApp here (download the file and un-zip): https://github.com/GitHub4Eddy/p1_monitor/archive/refs/tags/p1_monitor_20.zip or Fibaro Marketplace: https://marketplace.fibaro.com/items/p1-monitor How to install: Open the Configuration Interface Go to Settings > Devices Click + Choose Other Device Choose Upload File Choose file from your computer with .fqa


- 108 replies
-
- 3
-

-
- energy
- power meter
- (and 8 more)
-

Use stored energy data in Energy Panel selectbox not working?
Joep posted a question in Home Center 3
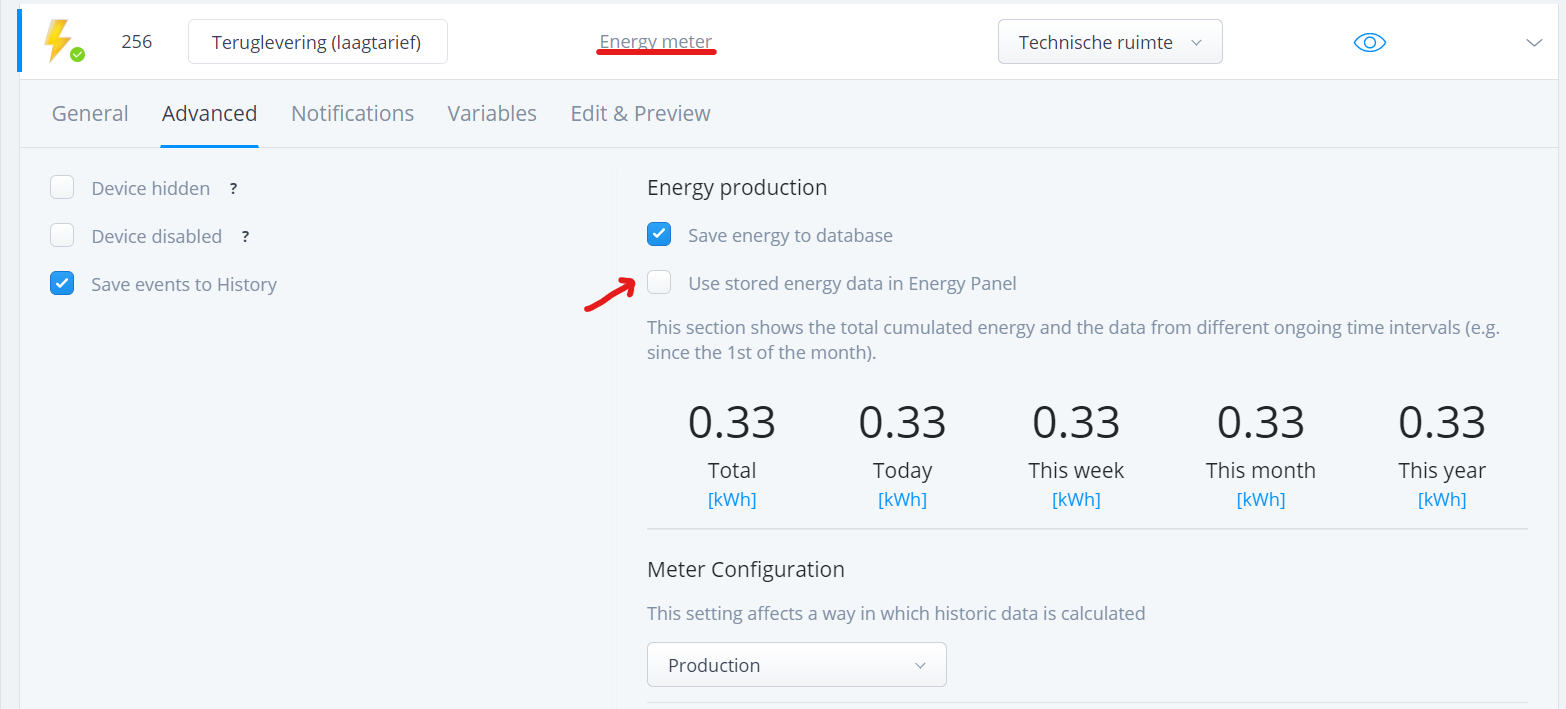
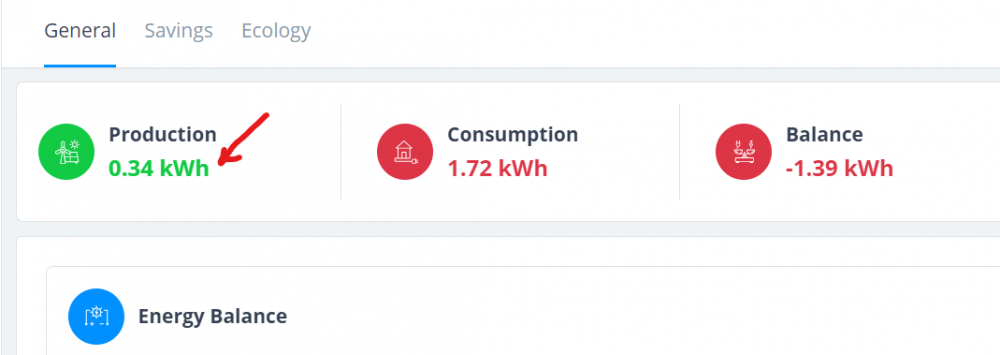
I'm working on a P1 meter readout for our smartmeter to feed the new Energy Panel. The QA has several child devices and two devices that return energy to the net. I gave this device the production meter configuration. I don't want to save this production data to the Energy Panel, because this is not real production, it's overhead energy that go's back to the grid. So I deselected the option Use stored energy data in Energy Panel: But the Energy Panel still displays the energy produced by this child device as production: The Energy Panel works this way right? 1. Production = Solar Panel energy 2. Consumption = Devices 3. Smart Meter consumption readout set as main devices = Smart Meter consumption - Devices = rest. 4. In the end of the day, when Energy Panel production - consumption is a positive number, this number must represent the Smart Meter return to grid value. The Energy Panel reporting the production (read overhead at p1) while the selectbox is unselected is a bug right?. Or am I thinking wrong? @m.roszak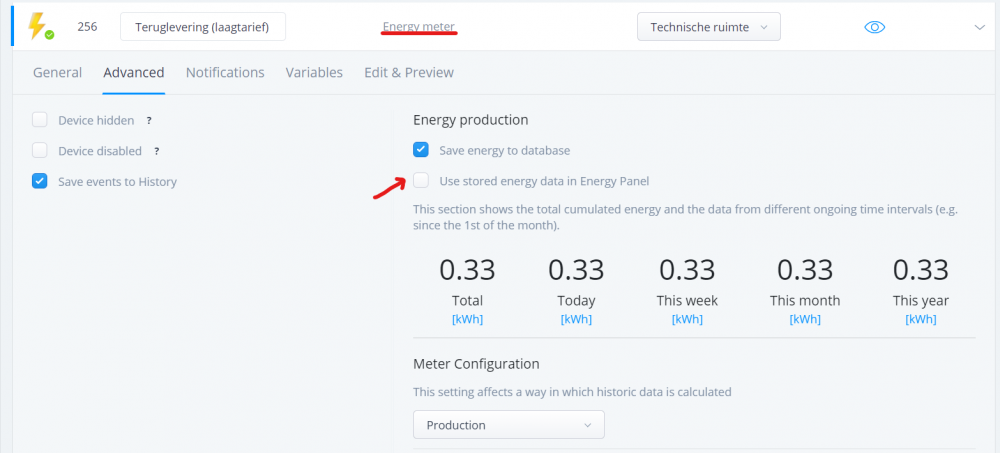
-
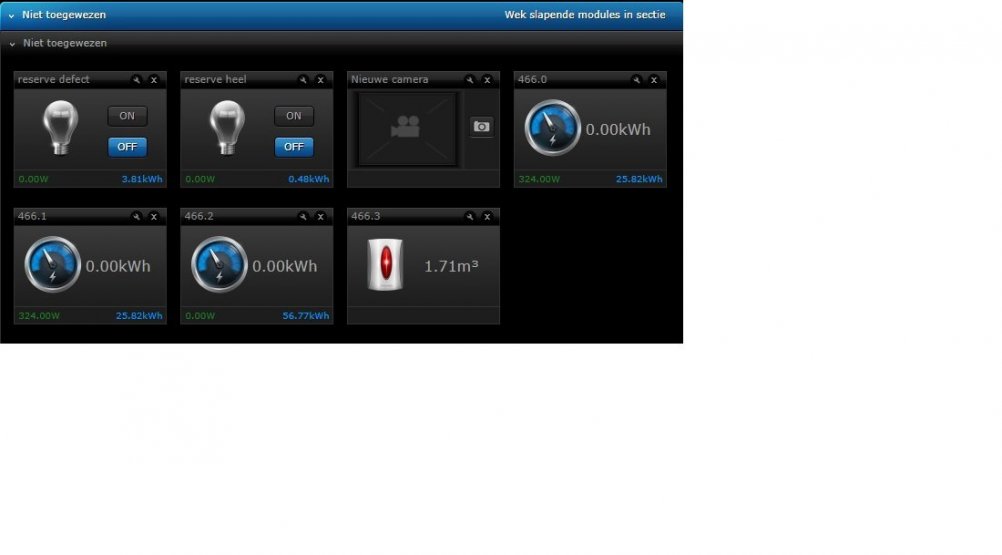
Hi all, The wife and I have done some work on getting json data from a Raspberry PI, running PI1Monitor. The Pi is reading the data from a smart meter P1 port and we built a virtual device that shows the meter readings in a VD screen. I included the VD and LUA-code. It's not pretty, but it works. We would like to take this to the next level, but here is where we need help. - Would it be possible to change the VD so it delivers the current usage to the power metering of the HC2. Right now, we have only some switches and dimmers that are counted in the power panel and we would like to have all power usage visible and we're not so interested in the usage of individual lights. We could use "some" help with that. - How can we add icons to the labels. We've seen some examples with beautiful screenshots, but we are stuck with plain text. Feel free to use the code. We're happy to share it with you. Regards, Erwin & Linda Slimme meter.lua Slimme_meter.vfib
- 57 replies
-
- 1
-
-
- p1
- smart meter
- (and 2 more)
-

HC-and a benext P1 dongle for energy measuring not updating
RobVeenis posted a question in Home Center 2
Dear Members, I recently bought a benext P1 dongle and conncted it to my intelligent electricity and gas meter. Both Landis & Gyr models E350 SMR 5.0 and G350 SMR 5.0 When I include the P1 dongle in the HC-2 I get an overview of the current powerconsumpyion an the current total usage of gas and electricity. However this figures never update. When I exclude and include the dongle or when I make a hard reset the same situation. New figures that are up to date and after no updates anymoer. Anyone a suggestion how to get constant updates from the dongle?