Welcome to Smart Home Forum by FIBARO
Dear Guest,
as you can notice parts of Smart Home Forum by FIBARO is not available for you. You have to register in order to view all content and post in our community. Don't worry! Registration is a simple free process that requires minimal information for you to sign up. Become a part of of Smart Home Forum by FIBARO by creating an account.
As a member you can:
- Start new topics and reply to others
- Follow topics and users to get email updates
- Get your own profile page and make new friends
- Send personal messages
- ... and learn a lot about our system!
Regards,
Smart Home Forum by FIBARO Team
All Activity
- Past hour
-

SONOFF SWV / ZigBee valve reliability
Vitruv posted a question in Other Devices / Third-party devices
Hi, I run a SONOFF SWV (ID 260, battery-powered) for garden irrigation on Yubii Home Pro 5.210.12. Three months flawless — then two problems: Problem 1 — hub.call() fire-and-forget: After a command flood (watchdog sending turnOff 50x in 1h — my own bug), the valve stopped accepting any remote commands. Physical button and status messages still worked. Fix: batteries out for minimum 5 minutes (60 seconds not enough). Question: Has anyone found a way to make hub.call() more reliable for ZigBee battery devices? I now send turnOff 3x with 2s gaps — any better approaches? Problem 2 — Device parameters: The device JSON shows autoOffDefaultTime: 900 but the Auto-off toggle in Yubii is greyed out for this device. When the valve is open and I manually enable Auto-off, it works — but resets to off after the valve closes. Question: Is there any way to set device parameters like autoOffDefaultTime permanently via Lua (hub.call or API)? The device supports it — Yubii just won't let me activate it persistently. Setup: Yubii Home Pro 5.210.12 · SONOFF SWV · ZigBee · battery-powered -
Hi, Nice/elero has a very useful feature in Yubii Home Pro: "Synchronize all devices" which forces the gateway to actively poll all devices and update their status. ZigBee has nothing equivalent. There is no network map, no forced sync, no mesh heal — and the mesh heal function that existed in older firmware has been removed. Is there any plan to re-introduce a ZigBee mesh management tool — even a basic one? Active polling or a network map would make a huge difference for diagnosing ZigBee issues. Setup: Yubii Home Pro 5.210.12, 4 ZigBee repeaters, mix of battery and mains-powered ZigBee devices.
-
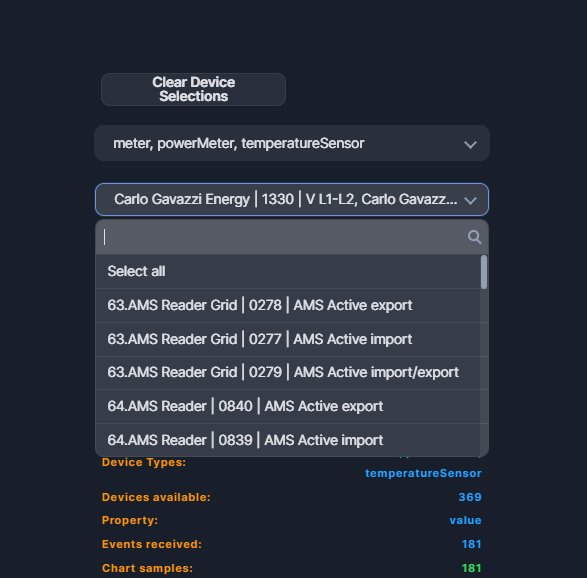
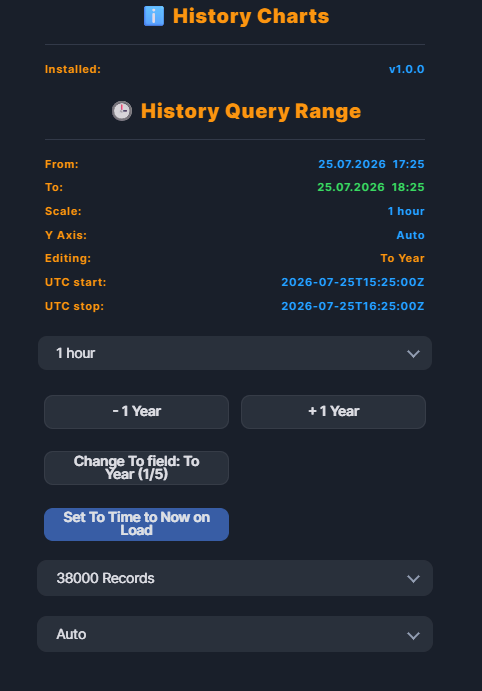
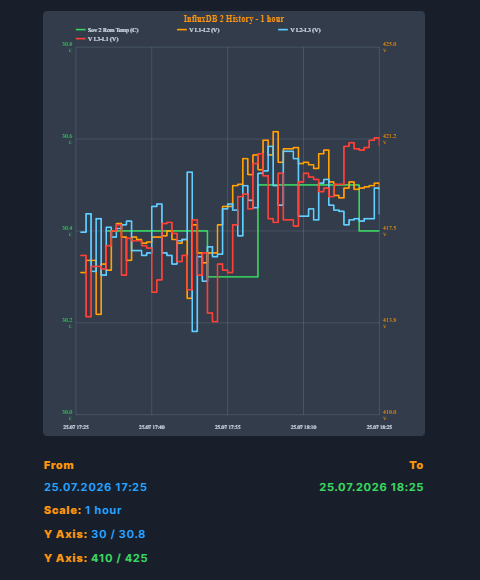
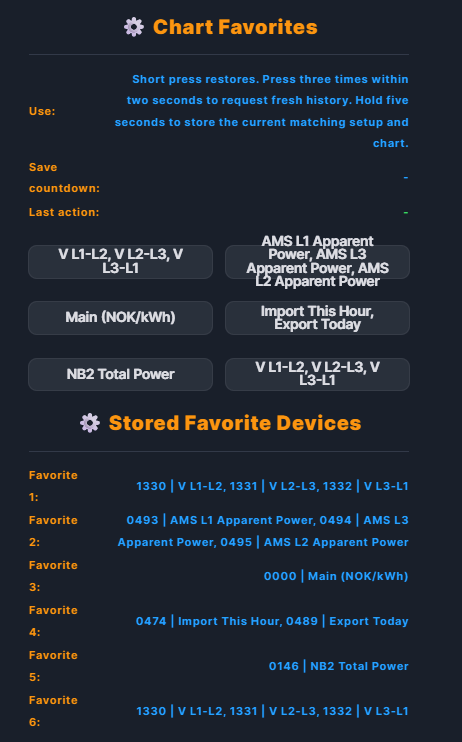
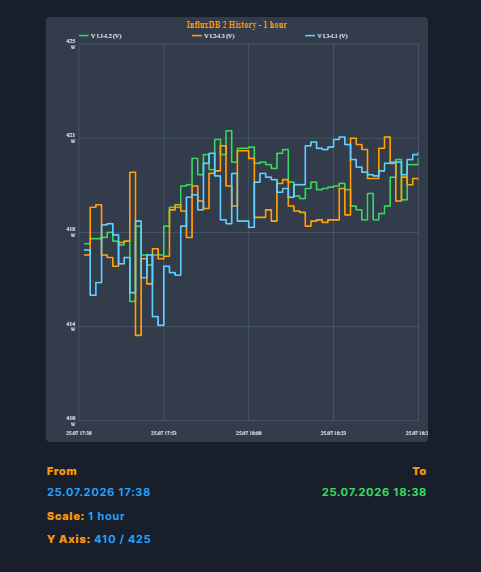
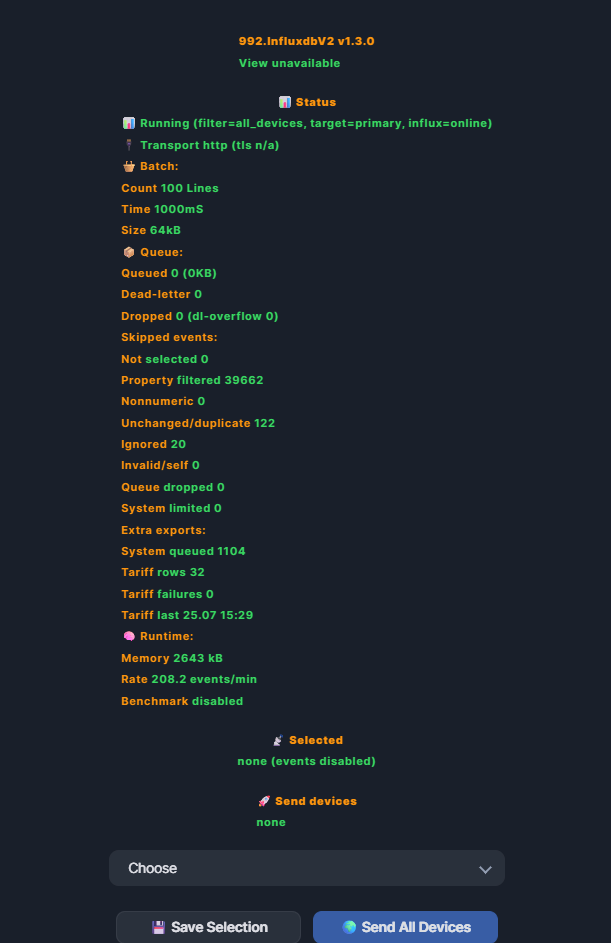
# 804. History Charts and 992. InfluxDB 2 I have created two companion QuickApps for collecting and displaying historical Fibaro HC3 device values: - **804. History Charts** displays historical values as SVG charts directly in the Fibaro interface. - **992. InfluxDB 2** continuously sends selected HC3 device values to an InfluxDB 2 server for longer retention and more detailed history. This is something I know many people have missed on the Fibaro HC3. We can now keep long-term history, display it inside the HC3 interface and compare several devices in the same chart. I am also open to suggestions and improvements! 😄 History Charts can retrieve data from either the built-in HC3 history API or an InfluxDB 2 server. The source is selected with a switch, so History Charts can be used by itself or together with the InfluxDB 2 QuickApp. The QuickApps have separate responsibilities: - **992. InfluxDB 2** is the writer. It listens for HC3 device changes and stores them in InfluxDB. Download v1.0.0: 992.InfluxdbV2.fqa - **804. History Charts** is the reader and chart renderer. It can read either HC3 History or the values stored by 992 in InfluxDB. You do not need 992 or an InfluxDB server to use HC3 History mode. Install both QuickApps when you want longer retention and InfluxDB-backed charts. Download v1.0.0: 804.History_Charts.fqa ## Usful URL's Fibaro Marketpalce URL: https://marketplace.fibaro.com/items/804-history-charts https://marketplace.fibaro.com/items/992-influxdb-2 Github: https://github.com/Brors94/992.InfluxdbV2 https://github.com/Brors94/804.History-Charts QA Dist Manager by @jgab, for possible to update Quickapps from the QA itself Thanks for all your Nice Tools Jgab!! Couldnt have made this without them! To find my Quickapps add this quickappvariable manifest to the QA Dist Manager: https://raw.githubusercontent.com/Brors94/HC3Quickapps/main/dist.json ## What the QA can do - Load historical values from the HC3 history API. - Query historical values from InfluxDB 2. - Display up to six devices in the same chart. - Use separate left and right Y-axes when devices have different units, for example temperature and power. - Keep the last value as a continuous step line between recorded changes. - Draw a blue zero-reference line when the chart contains values above and below zero. - Show the minimum, maximum and mean value for every displayed device. - Use raw InfluxDB values for the displayed minimum, maximum and mean statistics. - Convert cumulative kWh counters to hourly or daily consumption and display them as grouped bars. - Keep the previous chart visible until a new request has completed successfully. - Restore the last aggregated chart after a QuickApp restart. - Store six favorite chart setups for frequently used device combinations. - Display the current HC3 energy tariff schedule as a virtual Tariffs device type. ## Device selection The QA loads the HC3 device catalog and provides two multiselect lists: 1. Device Types 2. Device List ## Date, time and scale controls The To date and time can be edited by selecting year, month, day, hour or minute and then using the minus and plus switches. Holding a switch accelerates the adjustment. The **Set To Time to Now on Load** toggle updates the To value immediately before history is requested. Available chart scales currently include: - Manual (default) - 1 hour - 1 day - 2 days - 1 week - 2 weeks - 1 month - 2 months - 3 months - 6 months - 1 year - This Year - Last Year - This Month - Last Month - This Week - Last Week - Today - Yesterday When Manual is selected, the Change switch cycles through ten editable targets instead of five. The first five edit To year, month, day, hour and minute. The next five edit the corresponding From values. Minus and plus, including held acceleration, work for both timestamps. The relative scales derive From from the editable To time. The calendar scales use exact local calendar boundaries and refresh automatically when history is loaded. Current calendar periods end at the current minute, while Last Year, Last Month, Last Week and Yesterday cover the complete previous period. The record limit can be selected from 2,000 to 100,000 records per device. A configurable 200,000-record ceiling applies to the complete load, so the effective per-device limit is reduced automatically when many devices are selected. ## Y-axis modes The chart supports four Y-axis modes: - **Auto** adds suitable padding around the observed values. - **Include Zero** keeps zero inside the displayed range. - **Fixed Range** allows the minimum and maximum bounds to be adjusted manually. - **Min / Max** scales directly to the observed minimum and maximum values without additional space. Below From, To and Scale, the statistics header also shows the final minimum and maximum scale used by each rendered Y-axis. Dual-unit charts show two Y-Axis rows. This makes smaller variations easier to see. For example, a voltage chart containing values between 220 V and 240 V no longer needs to use a fixed 0–300 V scale. ## Favorites Six favorite switches are available above the notification setup. - Hold a favorite switch for five seconds to store the selected devices, query range, scale, Y-axis setup and current aggregated chart. - Press it once to restore the saved setup and chart. - Press it three times within two seconds to restore the favorite and request fresh values. The QA shows a countdown while a favorite is being saved and displays the device IDs and names stored in every favorite slot. ## HC3 tariff chart The virtual **Tariffs** device type reads the current tariff schedule from the HC3 energy billing endpoint and displays the rate in NOK/kWh. The QA automatically adopts the time range covered by the returned tariff schedule. The HC3 endpoint provides the current recurring schedule, not an archive of previous tariff definitions. But this is a bit work in progess so will come back to it ## 992. InfluxDB 2 writer The **992. InfluxDB 2** QuickApp collects HC3 device-property events and writes them to an InfluxDB 2 bucket using line protocol. It can: - Send values from selected HC3 devices or all devices. - Restrict exported properties with an allowlist, such as `value`, `power` and `energy`. - Store device ID, device name, room, device type and property information with the values. - Batch writes to reduce HTTP traffic. - Keep a bounded in-memory queue during temporary connection problems. - Retry transient failures with limits instead of retrying forever. - Use an optional failover InfluxDB endpoint. - Export bounded HC3 system-event telemetry. - Export the HC3 energy tariff schedule at startup and once per day. - Show connection, queue, filtering and transport diagnostics in its interface. The writer uses `value_num_v2` for numeric device values. History Charts can also read legacy `value` data, so charts can cover periods written before and after the field change. ## InfluxDB charts in 804. History Charts InfluxDB mode queries the selected HC3 device IDs and aggregates values to the current chart resolution on the server. This keeps the response and QuickApp memory bounded even when the database contains many raw records. Normal plotted lines use aggregated mean values, but the displayed Min, Max and Mean statistics are calculated separately from all raw values in the selected period. This preserves the real statistics and short spikes even when the chart line is smoothed by aggregation. When every selected device uses a cumulative kWh value, the QA uses the last counter value in each interval, calculates non-negative hourly or daily consumption deltas and renders the devices as grouped bars. The statistics header below the SVG shows the actual bar interval, for example `1 h`, `6 h`, or `24 h`. The **Records** selector is active in both source modes. HC3 applies the selected limit to each device request. InfluxDB applies it after `aggregateWindow`, so it limits the aggregated points returned per device or series rather than the raw database rows. Because the chart is normally reduced to about 300 points, the lowest 2,000-record setting will usually be sufficient for InfluxDB. The current writer schema uses the numeric field `value_num_v2`. The QA also reads older `value` data across the complete selected range and merges both schemas, preferring `value_num_v2` wherever both fields contain the same timestamp or chart interval. HTTP and HTTPS are supported. When HTTPS is selected, `tls_verify` controls whether the server certificate is validated. It has no effect in HTTP mode. On startup and after Reload Lists, History Charts automatically reads UUID-validated nonsecret connection settings from the `jbs992_InfluxdbV2` global, including the current measurement. Its existing 804 configuration remains the fallback if the 992 global is unavailable or invalid. A token configured specifically for History Charts through its QuickApp variable, Config or own global always takes precedence. This allows a write token for 992 and a separate read token for 804. The 992 token is used only as a last-resort fallback when History Charts has no token of its own. If InfluxDB returns HTTP 401 or 403, History Charts reports whether authentication failed or the token lacks read permission. When the rejected token came from the 992 fallback, the warning explains that it may be write-only and recommends configuring a separate read token for 804. The token is never displayed or written to the QA log, but HC3 global variables contain readable plaintext. The global and its backups must therefore be treated as sensitive. Do not publish screenshots, exported globals or configuration dumps containing an InfluxDB token. ## Saved state The QA stores only bounded, aggregated chart values rather than every raw history event. The latest successful chart survives a restart and can also be restored by a fresh QA using the same permanent UUID. The versioned `jbs804_History_Charts` global is refreshed on every enabled startup and daily at the configurable `BackupTime` while the QA is enabled. Factory Reset removes the QA-owned saved state and global backup. Restart preserves the configuration and saved charts. ## Language and interface support The QuickApp includes: - English - Norwegian - Dutch - Polish - Follow Home Center Language - Automatic Classic-view setup and a protected one-way switch back to Classic view - Enabled/disabled mode - CPU and memory diagnostics - Update controls - A built-in manual ## Versions - **804. History Charts:** v1.0.0 - **992. InfluxDBv2:** v1.0.0 ## Installation and configuration ### Using HC3 History only 1. Install 804. History Charts and its companion files. 2. Open the QuickApp and wait for the HC3 device list to load. 3. Select one or more device types and devices. 4. Select HC3 History as the source. 5. Select the time range, scale, record limit and Y-axis mode. 6. Press Load History. ### Using InfluxDB 2 1. Install and configure 992. InfluxDB 2 with the server, bucket, organization, measurement and token. 2. Select which HC3 devices and properties the writer should export, or enable Send All Devices. 3. Confirm in the 992 status labels that writes are reaching InfluxDB. 4. Install 804. History Charts. It automatically adopts the UUID-validated nonsecret connection settings from 992; configure a separate read token for 804 when desired. 5. Select InfluxDB 2 as the History Charts source. 6. Select the devices and requested time range, then press Load History. HC3 History mode works without an external database. InfluxDB mode requires an InfluxDB 2 server, bucket, organization and token with permission to query the selected bucket. ## Support continued development If you find these QuickApps useful, donations would be greatly appreciated. Contributions will help cover more AI token usage while developing, testing and improving these and future QuickApps. [Donate through PayPal](https://www.paypal.com/donate/?hosted_button_id=VUADCH6HQCYM2) Feedback, testing results and suggestions for additional chart types or supported device properties are welcome.

- Today
-
I've added nr and basicAuthorization support to v0.1.49 that I just pushed. It was left out from ER5. The third issue with temperature looks syntacticly correct. The error suggests that the variable temperature is a table...? Do you set the variable in some other rule?
-
 asturtelec joined the community
 - Yesterday
-
 kjbhkjb joined the community
 -
Dear Jan, all other Eventrunners, Two more things (in addition to the node-red integration) I struggle with whilst moving my rules from 5 to Eventrunner7 are the following: rule([[@13:07 & wday('fri') => _creds = fibaro.basicAuthorization('user','password'); log('#C:red#Restart HC3'); hc3api.post('/service/reboot',{recovery=false}) ]]) [24.07.2026] [13:07:00] [ERROR] [QUICKAPP859]: ❌ RULE4: attempt to call a nil value _creds = fibaro.basicAuthorization('user','password'); ^^^^^^^^^^^^^^^^^^ src: @13:07 & wday('fri') => _creds = fibaro.basicAuthorization('user','password'); log('#C:red#Restart HC3'); hc3api.post('/service/reboot',{recovery=false}) [24.07.2026] [13:07:00] [ERROR] [QUICKAPP859]: ❌ RULE4: Disabled src: @13:07 & wday('fri') => _creds = fibaro.basicAuthorization('user','password'); log('#C:red#Restart HC3'); hc3api.post('/service/reboot',{recovery=false}) and another one that works in 5 but not in 7: rule("vloerverwarming:isOff & (temperature:value < 17.0 ) & 08:00..23:00 & $Profile == 'Home' => vloerverwarming:on ") OUTPUT: 24.07.2026] [13:39:35] [DEBUG] [QUICKAPP572]: 🎬 RULE25: #device{"id":535,"value":22.0,"old":21.8,"property":"value"} [24.07.2026] [13:39:35] [ERROR] [QUICKAPP572]: ❌ RULE25: attempt to compare table with number vloerverwarming:isOff & (temperature:value < 17.0 ) & 08:00..23:00 & $Profile == 'Home' => vloerverwarming:on ^^^^^^^^^^^ Thanks for any guidance anyone might have. Wishing you all a great summer.
-
 Metorol AG joined the community
 - Last week
-
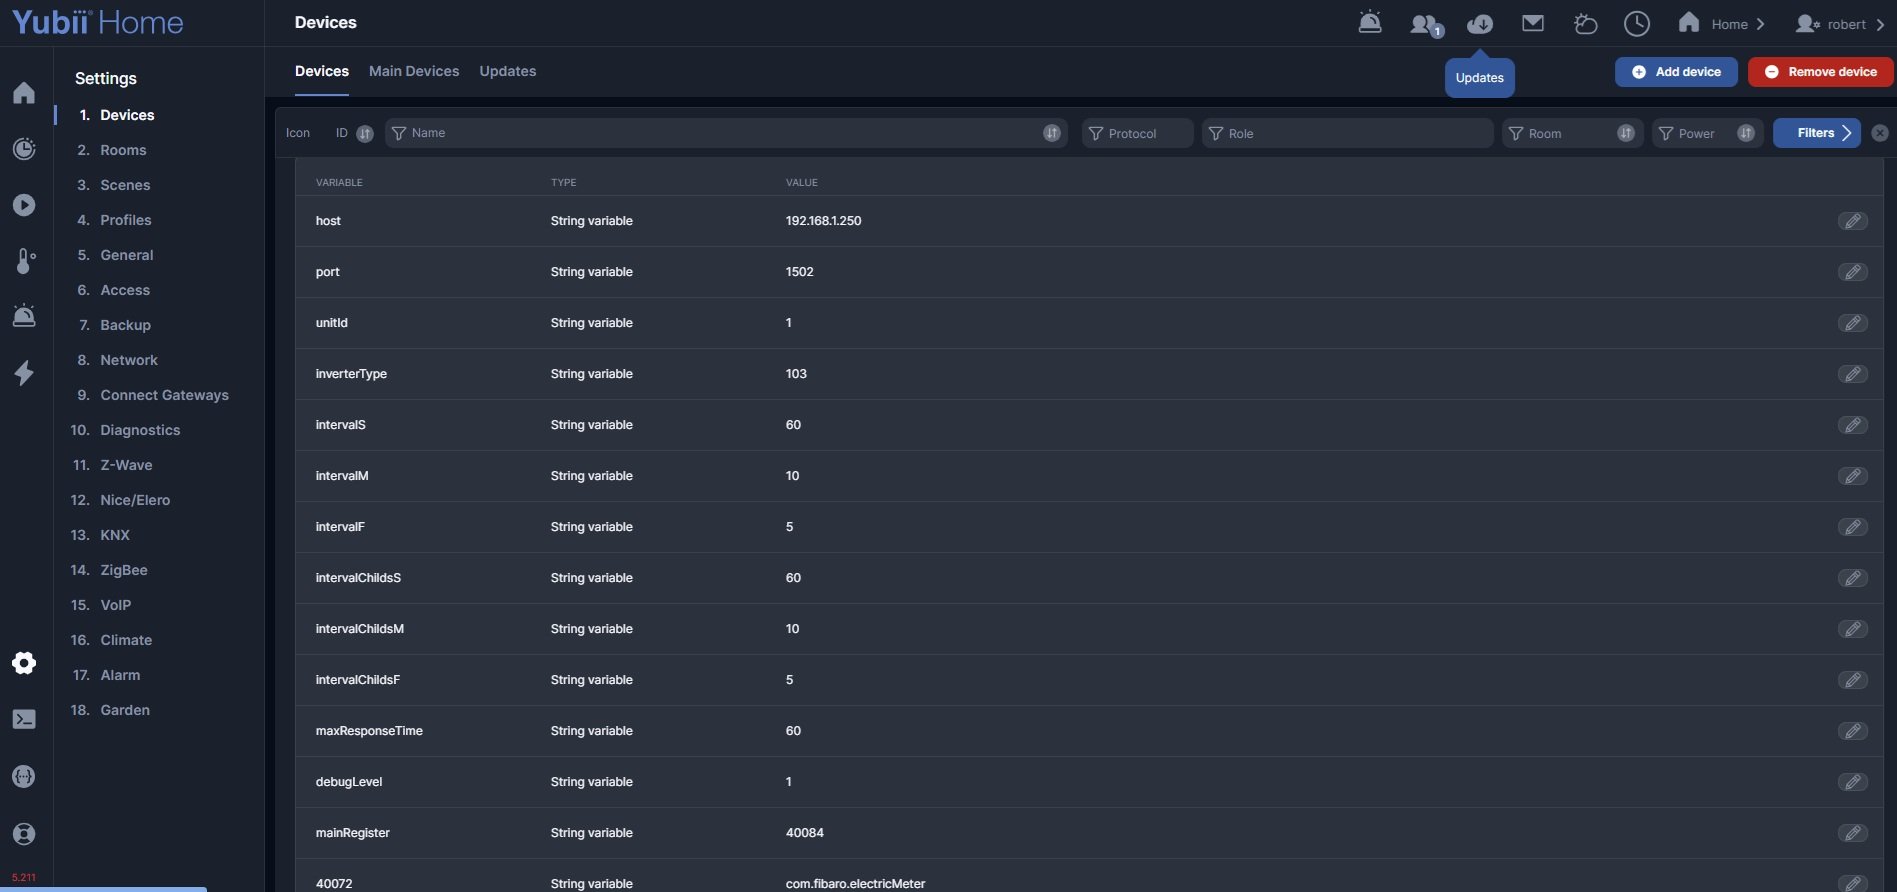
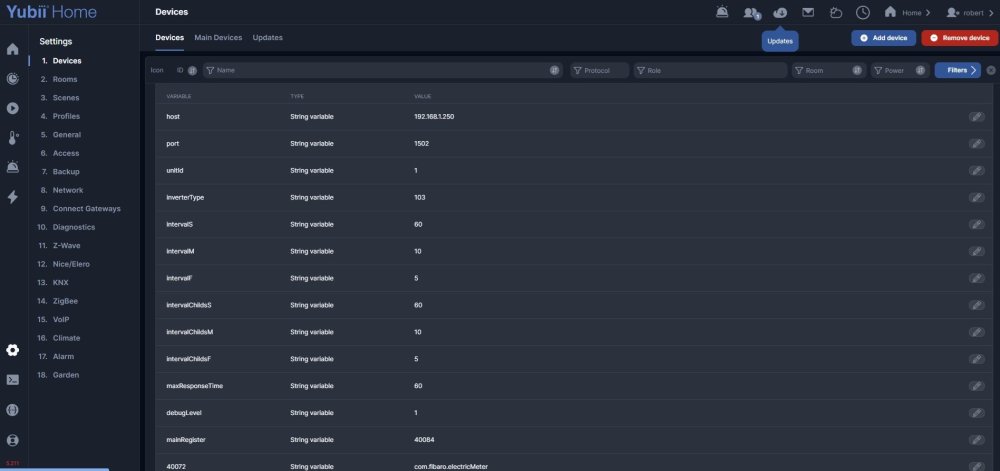
That is SolarEdge Live (ModBus), see also here for more tips and setup option: It is quit common to get "Socket CONNECT errors". It all depends on your WiFi connection and behaviour of your inverter. You can prevent the quickapp going into offline mode by raising the quickapp variable "maxResponseTime". My setting is 240 seconds.
-
 Gennadii joined the community
 -
Now it's working again. Thank you!
-
That was a strange bug... the problem seems to have been there for a long time... Try v1.3.14
- 144 replies
-
- 1
-

-
- quickapp
- development
- (and 1 more)
-
-
Hi @reso007 could be anything. But what SolarEdge quickapp are you talking about?
-
Hi solaredge quick app goes offline at least once a day. until last week it worked OK.
-
 Quy Phung joined the community
 -
please contact support for the assistance.
-
Good morning, I've noticed that: fibaro.getValue(1, "sunsetHour") stopped working on plua emulator (up to date version) - returns nil. With sunriseHour - the same. Sooner it's working on the emulator. On real box - it's working as well.
-
 Dejwinci joined the community
 -
micronature joined the community
-
 Junior joined the community
 -
 Johnkrabbenborg joined the community
 -
davidpalovcik joined the community
-
 Thank you @Sankotronic for your comment and improvements. We will verify what we can implement
- 1 reply
-
- 1
-
-
same here, it's mark as solved but I have no way to select and so to connect my elero product, if there is no solution I have to return the hub
-
Sorry was asking Ical is not in QA-Dist manager. Jan, perhaps a good idea to add it??
-
-
 Hi, We can confirm that there is a problem with refreshing the selection after updateView calls, and it requires reopening the devices preview. It acts the same way in web UI and Yubii Home APP. A bug has been reported. Web part should be fixed in the next beta update (5.212). I agree that the naming of what needs to be used in updateView may not be clear, and does not match the actual naming of properties in the view. I've attached simple examples of how to use single and multi-selects single_select_demo.fqa multi_select_demo.fqa I'll also try to clarify the naming and usage: selection in single select, use "selectedItem" and provide a string value. eg self:updateView("modeSelector", "selectedItem", "auto"). You can clear it out by providing an empty string. eg self:updateView("modeSelector", "selectedItem", ""). selection in multi select, use "selectedItems" and provide an array of string values. eg. self:updateView("modeSelector", "selectedItems", {"auto", "manual"}). You can clear it out by providing an empty array. eg. self:updateView("modeSelector", "selectedItems", json.array()). Why json.array() and not {}? An empty Lua table ({}) is a bit ambiguous. By default, it's encoded as an empty object since Lua tables are associative arrays (https://www.lua.org/pil/2.5.html). Of course, non-empty Lua tables are encoded correctly depending on the content. You can try it by printing this print(json.encode({})) print(json.encode(json.array())) print(json.encode({"array element"})) print(json.encode({object = "element"})) after updating selector options, you don't need to update the selection. Those properties are independent, and selected options are preserved. So update the selection only if you need to. I know that right now the web UI clears the selection when options are updated, but that will also be fixed. Selection will disappear only if the selected option is not present in the new options list. I don't see any way to force the refresh of the device preview, but I'll look into it a bit more. Hope this helps edit: I forgot to mention - old view ("Use the new views in mobile application" checkbox unchecked) already works fine with provided code samples.
- 1 reply
-
- 1
-

-

How to check the exact "Device Dead" timestamp in Home Center Lite?
cag014 replied to Thiago Muniz's question in Double Switch 2
try this API. http://[HCL_IP]/api/devices/[device-ID]/properties/dead You should see last value - in your case is true and last modified timestamp An example: { "value": true, "modified": 1781734611 } Convert the "modified" timestamp to find out exact date and time. example print(os.date("!%Y-%m-%d %H:%M:%S", 1781734611)) output -> 2026-06-17 22:16:51- 1 reply
-
- 1
-
-
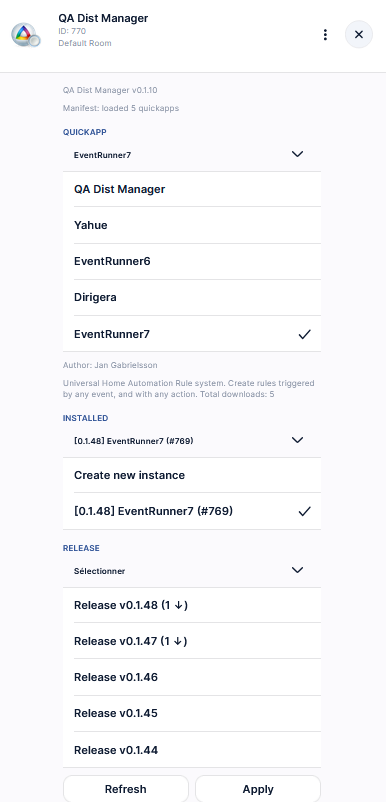
Hi, If you use QA Dist Manager from Jgab, you will see that: So the latest is 0.1.48 BTW, I dont know what means the digit and arrow inside brackets...
- Earlier
-
Jan, I want to reintroduce ICal. What's the latest version?
-
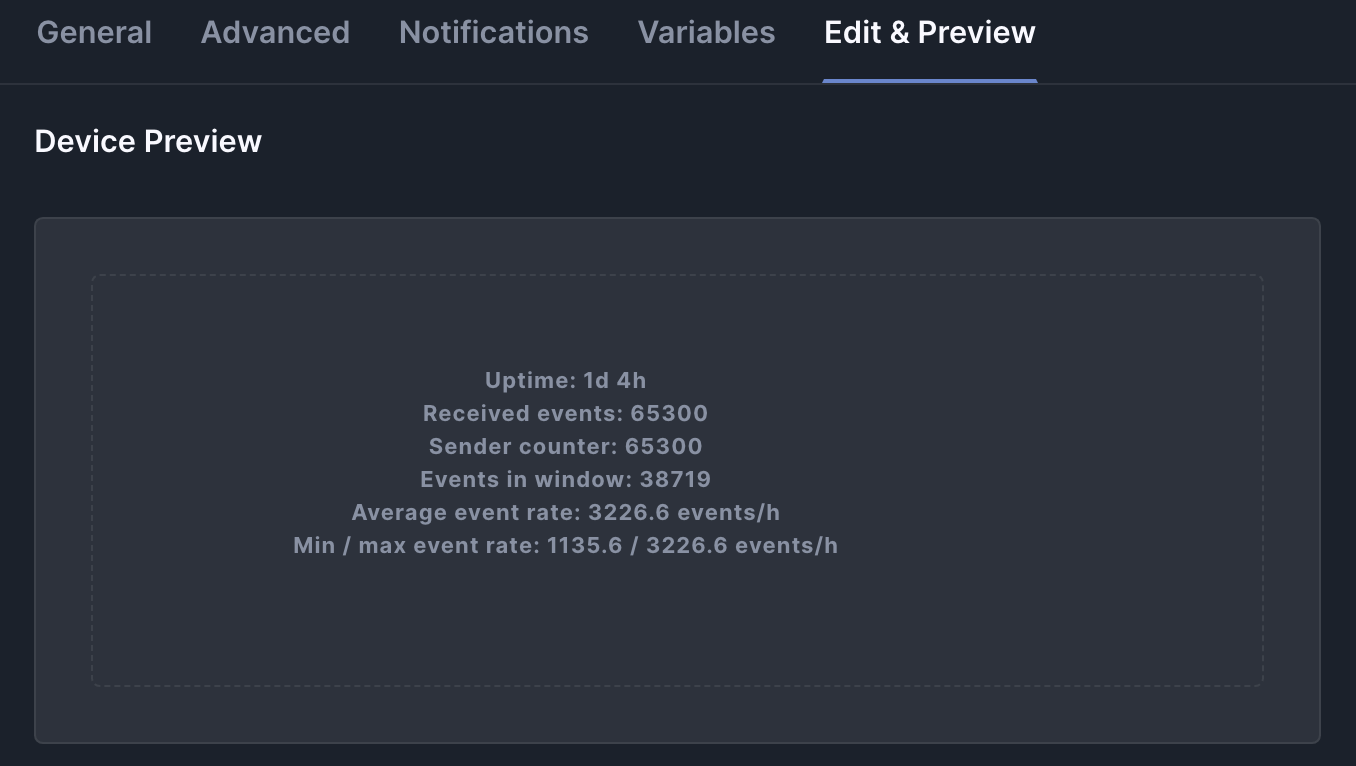
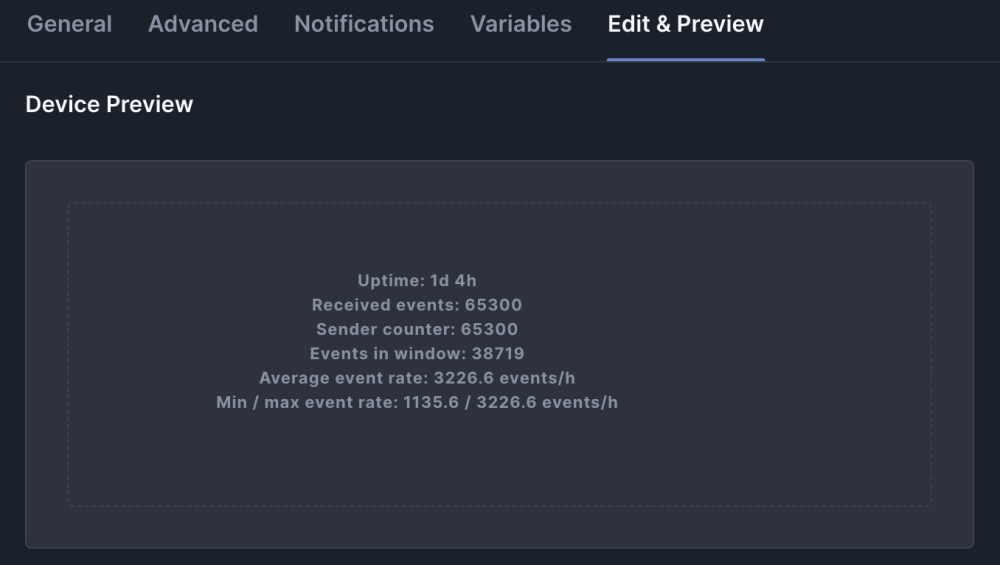
Here's the test result after over a day of continuous use. As we can see the hub.call communication can be assumed to be very reliable. None of 65k calls was lost. It was not so clear for me - this is the box who decide about broadcast the call. It can be seen how many events is generated in ~100 devices installation.
-
 Hello everyone, I need some help finding specific historical data in my Home Center Lite (HCL). One of my smart plugs (used for energy metering on a TV) was unplugged/disconnected from the wall by someone, and the power line was bypassed. I can see the "X" icon on the device dashboard showing it is currently dead. However, I need to find the exact date and time when this device lost power/connection to know when it was physically removed. Is there a way to extract this specific "Device marked as dead" timestamp from the HCL Event Panel or via an API call? Any guidance on how to track this down would be greatly appreciated. Thanks in advance!
 -
Let me answer at some length, because it may indeed seem strange that I have been showing off various ideas, but somehow never include the code. The programs I write, and in general the area of programming that interests me, are not particularly popular in our community. For example, I am not interested at all in creating integrations with various devices, which are desired by the community, and rightly so. What I do interests, I think, only a handful of people, who nevertheless provide me with a certain amount of support and satisfaction through their likes. Before I sit down to program, I spend many hours constructing the contract, deciding how it is all supposed to work. I am not a professional programmer, only an amateur, but this is what the DNSfD project taught me: a concept that is wrong in one small but crucial place means either throwing the code away or going through the torments of Tantalus while trying to “repair” it. You should also know that this is not a simple program, such as a controller for blinds or a fireplace. It is around 3,000 lines of code. It would have to be tested thoroughly, because bugs and failures in a server-based model can be mysterious and difficult to track down. I didn't do this to the end, yet. Creating client-server software requires a particular kind of experience. It is an area which, it seems to me, really follows its own rules. Something always appears that you had not anticipated, even after spending a long time thinking about how everything should work. TableMan happens to be a relatively simple project, although it has quite an extensive “construction language.” But even there I have already added things I had not expected. Another project, DNSfD, showed very clearly how difficult it is to explain to the community a concept that is systemic, tool-oriented. It also showed that more sophisticated, automated and elegant solutions do not necessarily win. Not because they are bad, but because first you still have to explain why they exist at all and how they are supposed to be used. Documentation would also have to be written. AI would probably help with that, but it would not do everything. I simply cannot find the time for it anymore. It would probably be a solid 20 to 30 pages in two languages. On the other hand, the era of sweet idleness in my life came to an end, suddenly and unexpectedly, and I had to turn programming into an additional source of income. In short, in my situation these would have to be paid solutions, so that I could be fully available to users. That, in turn, creates other problems which I am not actually in a position to deal with. I will think some more about this particular project, but for now I have to admit that, as a general rule, I had no intention of publishing these programs. I only intended to publish information about them, which may also be valuable in some way. I apologize for this somewhat chaotic and, as usual, long reply, but I am simply writing what I think.
-
I will think about it and answer soon.