About This File
This scene monitors and catches Z-wave commands traffic between controller and devices. The data displayed to user as a table which includes total commands and their properties per device, in addition same data displayed at graphical chart and shows system activities over the time. Since Z-wave protocol is not a fastest one (in many case it's just freeze) this code helps to analyze the data and to take necessary actions to reduce overall Z-wave traffic and system load.
Scene functionality
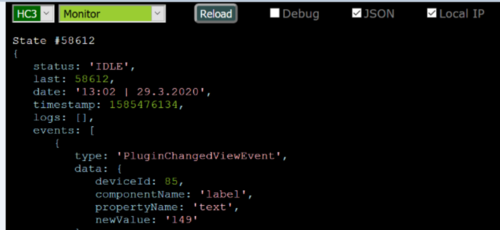
1. This is not an auto started scene. You need to start it manually. While the scene is running, you can switch views between table/chart and monitor (follow instructions on screen).
2. User configurable parameters are:
gVar = true-- Create and use global predefined variable. The scene could work with local table as well, but by using global parameter you can keep history of the traffic. It very helpful when you're updating the system to new release, to compare Z-wave performance. In case you have decided to use global variable, copy the data to other variable to keep the history. To view data of saved variable please download and use Z-wave Viewer scene. Z-wave Viewer could be executed in parallel to Z-wave Monitor as well (when using global variable only)
logRate = 5 -- Time rate in minutes to log Z-wave activity. Used as axis X scale in charts view. Reasonable value 5 to15 minutes for 24 hours of monitoring. In case to achieve better resolution the value could be decreased down to 1 minute.
time2monitor = 6 -- Time-slot in hours to monitor z-wave traffic, after that time, table and chart will be displayed on debug window and scene will stopped. Value of 0 hours disables auto ending. User needs to stop the monitoring. If less than hour monitoring required please use decimal fraction. For example to set monitor time to 15 minutes set, time2monitor = .25
markId = "|0|0|", " Cyan" -- Devices (IDs) list and text color to display specific devices in defined color at monitor view for follow up purpose. In few cases you need to monitor specific device, so fill-in the device ID and it will be highlighted by different color from other devices.
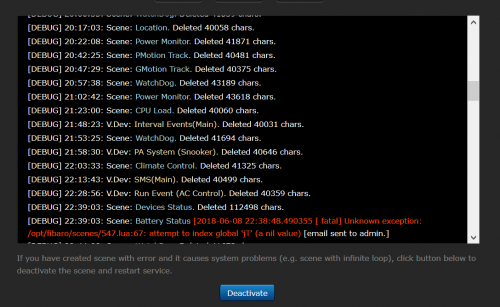
deadOnTop = {true, "maroon"} -- Display DEAD devices on top of the monitor view list in defined text color. Since we're not always looking on the screen, so in case the system will identify dead device it will continuously display the device (in red) on debug window.
All variables below are the same for Z-wave Monitor and Z-wave Viewer
chartHeight = 100 -- Chart height in percents (%). Chart's default height fits debug window. The variable changes height of all charts (devices.scenes and events)
chartWidth = 100 -- Chart width in percents (%). Chart's default width expands according to number of samples. User could expand the width to get better detail view or to stretch to visualize the load on time axis or to take snap shot of entire time line. The variable changes width of all charts (devices.scenes and events)
topDev2disp = 6 -- Number of most active devices to display on devices chart. If set to zero chart won't be displayed.
topScene2disp= 10 -- Number of most active scenes to display on scenes chart. If set to zero chart won't be displayed.
darkSkinMode = true -- Charts display skin mode. Set false for light (white) skin.
dev2review={false,"|470|804"} -- Generate chart for every device in list of actual device readings over the monitoring time. For devices with two results (like power and energy) both reading will be displayed. On left and right sides of the chart applicable scale displayed. Please note, no chart is generated for devices like motion, door and any other sensors, which provide values of true/false.
userDev={false,"|504|_531|"} -- User defined devices and scenes IDs to generate specific combined chart. Please write underscore before scene ID |_531|
stackedChart=true -- A stacked line chart is an line chart in which lines do not overlap because they are cumulative at each point. Set to false to view standard line char. All charts except ZKG chart (events,CPU and RAM) will be displayed according to this variable.
Brief explanation what is displayed:
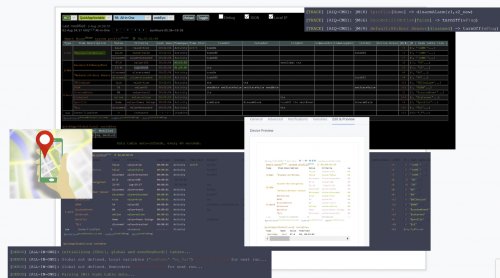
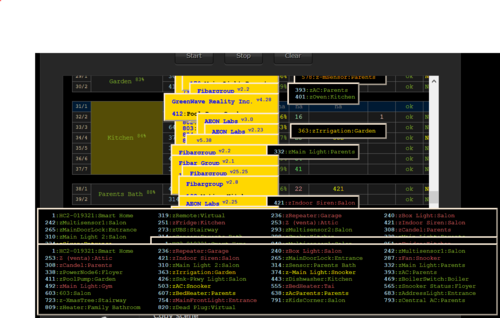
1. Monitor view
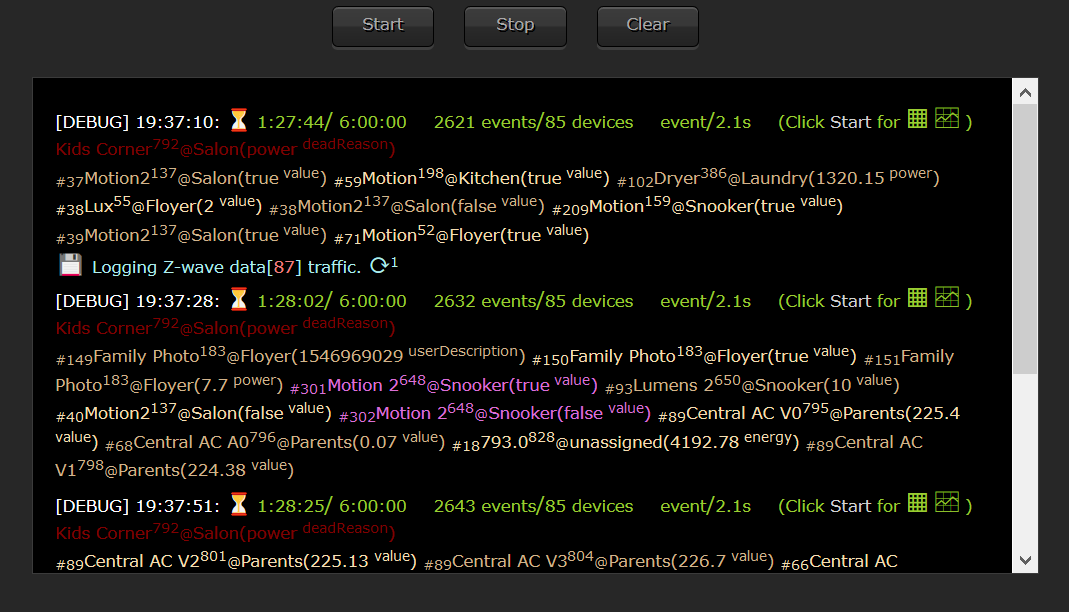
This snap shot includes top and dead devices marked in different color from other devices.
Two main sections in this view:
Header
1:08:07/ 6:00:00 1824 events/77 devices event/2.3s (Click Start for )
Elapsed Time/Monitoring time Number of Z-wave events/devices Z-wave traffic rate Click to switch to table/chart view
Devices list
Every device displayed at follow format -
#2/34TV509@Salon(216.7 power)
#2/34 -First number is number of events during logRate slot. Second number is total number for events so far.
TV509@Salon - device name, ID and room name
(216.7 power) - actual reading and reading property
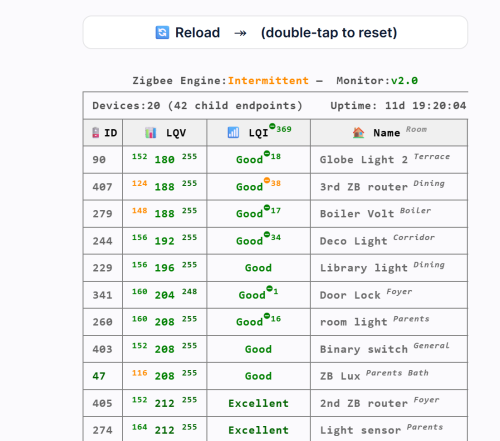
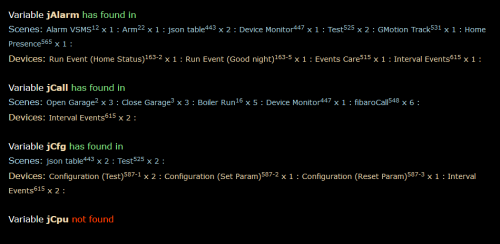
2. Table view
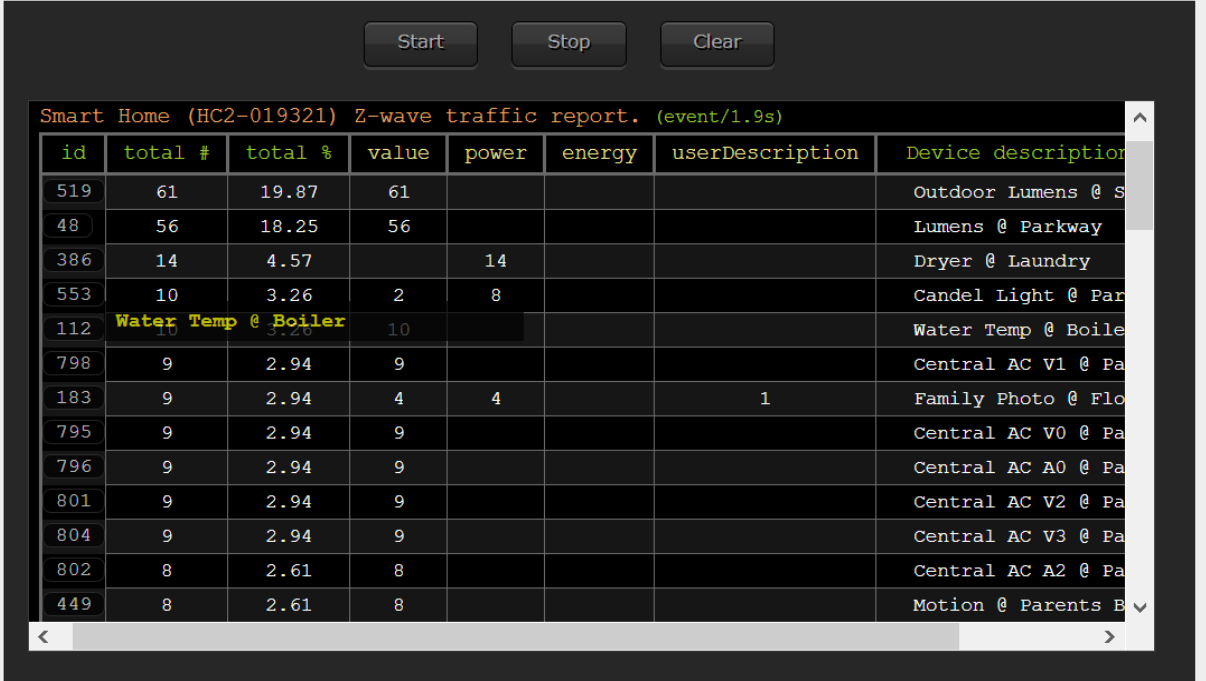
total # - number of total Z-wave events on device
total % - Percentage of device's events of total system Z-wave events.
All yellow marked headers are received Z-wave properties, except two properties, dead and deadReason which are marked in red. For each device displayed the total number of this specific properties. Red marked ID, means that device was or is "dead"
By hovering mouse over device IDs, device and room names will be display (tool-tip) at popup box.
At the end displayed few extra summaries

Elapsed time and Start-End timestamps
Sample log rate as defined by user. Total samples during monitoring time
Total Z-wave events and total number of active devices
Average Z-wave traffic rate
Z-traffic range. Shows the highest and lowest z-wave activities during monitoring time.
If dead devices have found, list of them is displayed
3. Most active devices chart
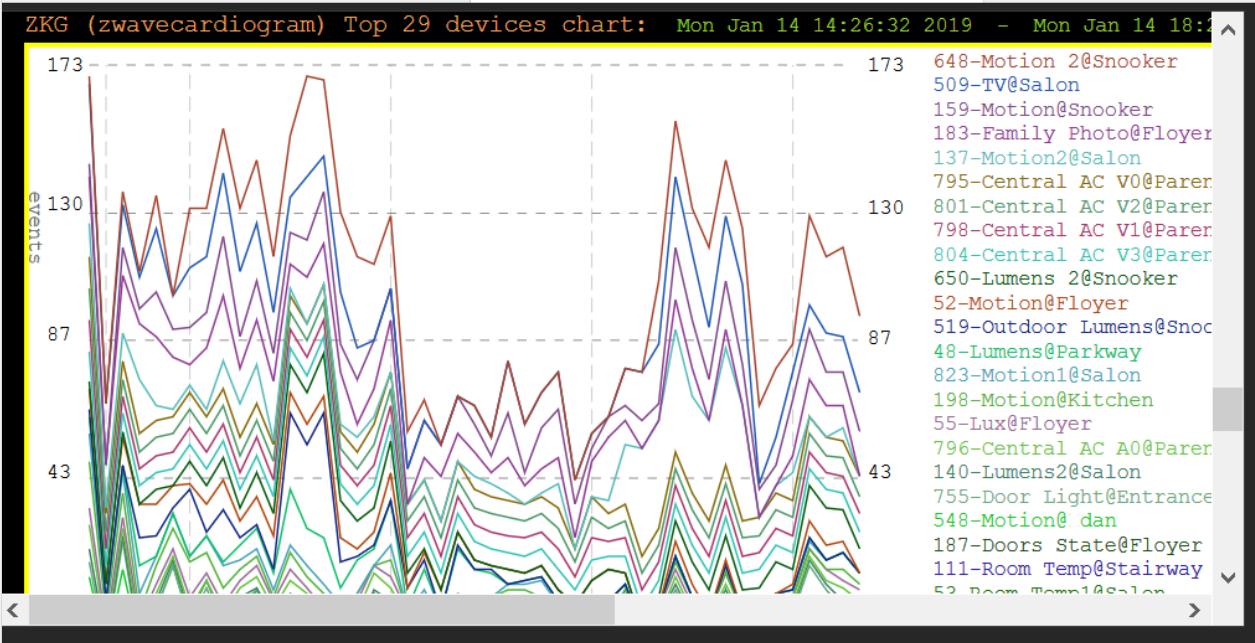
Example of stacked chart
This chart shows events number of most active devices ( up to number of all active devices allowed by setting topDevNum variable ) on monitoring time-line. On the right-upper corner displayed ID, name and room of the device. By hovering mouse on diagrams or legend, selected item will emphasized in bold to make the item more visible.
4. Most active scenes chart
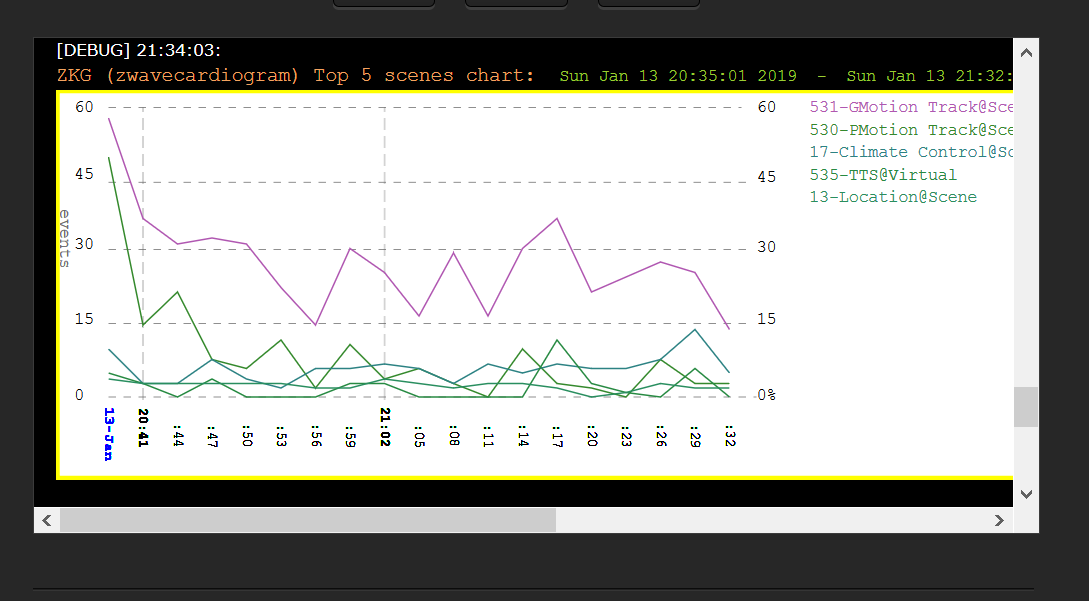
This chart shows triggers number of most active scenes ( up to number of all triggered scenes allowed by setting topDevNum variable ) on monitoring time-line. On the right-upper corner displayed ID, name and room of the scenes. By hovering mouse on diagrams or legend, selected item will emphasized in bold to make the item more visible.
5. Review device's actual readings - (dev2review)

For devices with two results (like power and energy) both reading will be displayed. On left and right sides of the chart applicable scale displayed.
This chart most useful to identify if device configured to send reports interval at high rate and " differ in readings to send report" set to very low value.
By hovering mouse over the chart, will scale down the diagram to make visible entire range. In case the horizontal scrollbar is not in the middle of the chart , the diagram will flicker.
6. User defined combined chart
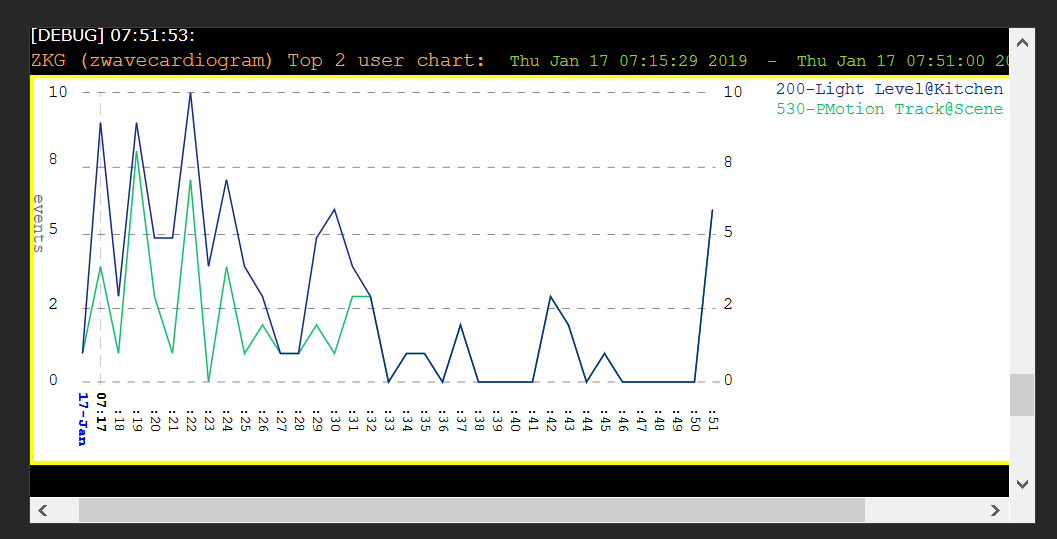
In some cases we need to inspect behavior of some devices and scene that triggered by the device. This chart shows user defined devices and scenes on monitoring time-line. On the right-upper corner displayed ID, name and room of the scenes and/or device. By hovering mouse on diagrams or legend, selected item will emphasized in bold to make the item more visible.
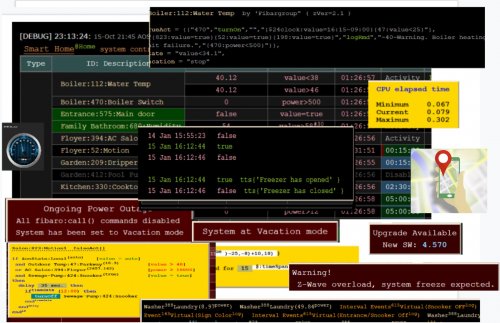
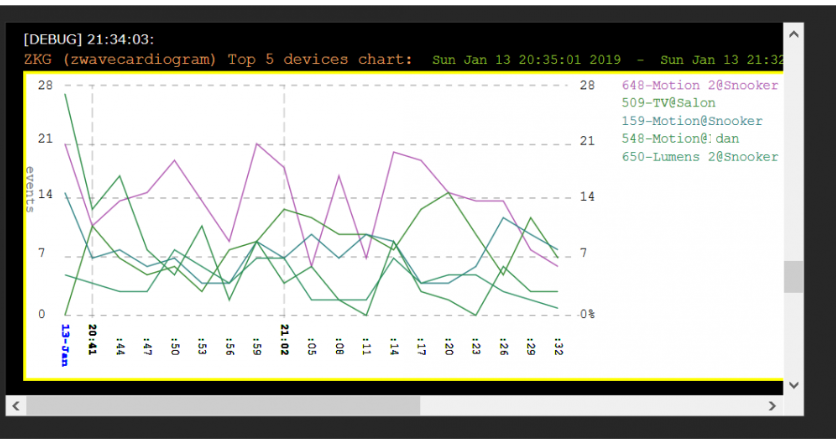
7. ZKG Chart View

Chart view shows Z-wave traffic and system load on time line (based on logRate value). You actually could see your smart home beating heart (like EKG). I have named as ZKG (Z-wave cardiogram). Now it's possible to see the "rush" and "quiet" hours of the system.
Chart view includes 5 diagrams displayed over time-line of monitoring period. The diagrams are:
- Z-wave events
- Triggered scenes
- CPU1 percentage
- CPU2 percentage
- RAM percentage
At top-right corner of the screen, displayed legend of the diagrams and colors.
Events total number in same color as a diagram line.
CPU1 min > avg < max in same color as a diagram line.
CPU2 min > avg < max in same color as a diagram line.
RAM min > avg < max in same color as a diagram line.
Triggered scenes total in same color as a diagram line.
Most triggered scene ID and scene's name in same color as a triggered scenes
In case dead devices have found during the monitoring period, the time stamp where it happened will colored red and at the top of the screen, directly above the time stamp, dead device(s) ID displayed.
Axis Y has two scales. Left scale represents occurrence numbers of Z-wave events and triggered scenes. Right scale is a percentage and it related to CPU1, CPU2 and RAM measured values.
By hovering mouse on diagrams or legend, selected item will emphasized in bold to make the item more visible.
I'm strongly advising to use global variable and to view the data using Z-wave Viewer in parallel to Z-wave Monitor
The idea behind, that you can change parameters to view different devices/scenes on the fly.
By changing user configurable parameters in Z-wave Monitor you'll need to start the scene all over again.
Note:
The debug text of these scenes is very big, so If you're using Clear Debug scene, please remove these scenes from the list.
Please let me know if extra info is required.
Please report if any bug occurred.
What's New in Version 2.0 See changelog
Released
Totally new look, HTML/CSS table and SVG chart. Please see main description at About this file section above.
The new version brings more ability to analyze your smart home Z-wave behavior and actually to see the heart beat of the system.
May be I'm over rating, but have found that it is very handy and helpful tool.
I'm removing the previous versions.