Welcome to Smart Home Forum by FIBARO
Dear Guest,
as you can notice parts of Smart Home Forum by FIBARO is not available for you. You have to register in order to view all content and post in our community. Don't worry! Registration is a simple free process that requires minimal information for you to sign up. Become a part of of Smart Home Forum by FIBARO by creating an account.
As a member you can:
- Start new topics and reply to others
- Follow topics and users to get email updates
- Get your own profile page and make new friends
- Send personal messages
- ... and learn a lot about our system!
Regards,
Smart Home Forum by FIBARO Team
Search the Community
Showing results for tags 'cag014'.
-
Many users have downloaded All-in-One Scene and I believe there are some questions about usage. The purpose of this topic is to help to get most of All-in-One Scene , to share best ideas/actions and solutions. Please feel free to ask any scene's related question and I'll share my best solution with you.
-
Version 2.1
198 downloads
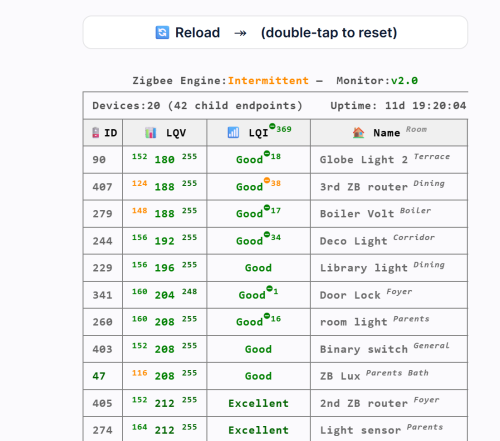
⚡ Zigbee Monitor – A Complete Health Dashboard for Your Zigbee This QuickApp gives you a real‑time, high‑precision diagnostic view of your entire ZigBee network. It tracks every device, evaluates link quality, detects ZigBee Engine freezes or crashes, highlights weak or unstable nodes, monitors battery health, and records communication drops over time. Automatic sorting, color‑coded warnings, min/max LQI history, and intelligent ZigBee Engine health scoring, it turns your HC3 into a full ZigBee analytics console—making mesh problems visible instantly instead of guessing in the dark. 📑 Table Columns 🪫 ID Device ID with battery status. Battery devices show color‑coded percentage; routers show “Serves as Router.” Ghost nodes appear as 👻. 📊 LQV (LQI value) Shows min / current / max LQI values recorded since last reset. Helps identify unstable or fluctuating devices. 📶 LQI (Quality Status) Color‑coded signal quality label: Excellent, Good, Weak, Poor, Critical. Includes drop‑severity superscripts when applicable. ❤️ Alive Displayed only when at least one device is dead. Shows “false” in red for non‑responsive nodes. 🏠 Name Room Device name with room shown in superscript. Ghost devices show their IEEE address instead. 📦 Type Indicates whether the device is Battery‑Powered (with percentage) or Serves as Router. 🔖 Vendor Manufacturer reported by the ZigBee device. 🔢 Model Device model identifier (e.g., E1743, SNZB‑02). 🧬 Family Routing family chain showing how HC3 child devices relate to each other (e.g., 123👥🡒456🡒789). Requirements HC3 with ZigBee enabled QuickApp variables: user, password (secured) User and Password The QuickApp needs credentials to access the internal ZigBee API through the HC3 proxy. Enter its username and password in the QA’s Variables tab. The QA automatically encodes these values and uses them only for read‑only Zigbee queries. Note: For security, you can create a dedicated HC3 user with limited permissions (not your main admin account) What It Shows ZigBee Engine status ID, LQV (with min/max range), LQI status, Alive (if needed), Name and Room, Type, Vendor, Model, Family. Please download and review the ZigBee Monitor User’s Guide for further details. You can also download the ZigBee & HC3 Capacity Planning Guide, which helps you build a more stable and reliable ZigBee network. -
Version 22.0
4,310 downloads
🧠 What AOQ (All-in-One QuickApp) Offers Multi-System Control: Seamlessly manages HC3, HC2, and HCL controllers using master/slave architecture. Unified Automation: Replaces scattered Lua and Block scenes with one centralized QA. Device Intelligence: Auto-detects Z-Wave, ZigBee, Nice, QA devices, and scenes. Alarm Zone Management: Identifies breached zones/sensors and triggers actions. Custom Events & Profiles: Supports dynamic profiles and custom rule-based automation. 🛠️ Core Configuration: Job Management - jM{} Hash Table Each line in jM{} includes: Field Description Time Span Duration in minutes for monitoring or action. 0 = activity only, negative = suspended IDs List Devices/scenes/variables/keywords (e.g., `"137,630"or"_45"` for scenes) Criteria & Rules Optional conditions like state="value=true" or property="power" Action Tables Optional commands: trueAct{}, falseAct{}, trigAct{}, etc. 🔄 Device Aliasing with jS2n{} Avoid hardcoding device IDs: jS2n = {mSensor=200, boiler=137, dryer=630, light=230, timeScene="_17"} Use aliases in jM{}: jM={ {15,"`mSensor`",{state="value=true", trueAct={"`light`", "turnOn"},falseAct={"`light`", "turnOff"}}} } 🔍 Monitor Option Detects inactivity or failure to report: {8, "`timeScene` and _545", {timeSlot="10:00~22:00"}} -- scenes must be active every 8 min between 10am to 22pm {10, "`boiler`and 145", {property="power"}} -- must report power every 10 min {30, "`boiler`", {state="power>100"}} -- alert if power >100 for 30 min ⚙️ Control Option Example: Turn on light when motion sensor is breached, turn off after 3 min when motion sensor back to safe: jM={"`mSensor`",{state="value=true",trueAct={"`lightSw`","turnOn"},falseAct={"`lightSw`","turnOff", "180"}}} To restrict to nighttime: jM={"`mSensor`",{state="value=true",timeslot="18:00~07:00", trueAct={"`lightSw`","turnOn"},falseAct={"`lightSw`","turnOff", "180"}}} Example: Turn on light when motion sensor is breached, turn off after 3 min (regardless of when motion sensor back to safe) jM={"`mSensor`",{state="value=true", trueAct={{"`lightSw`","turnOn"},{"`lightSw`","turnOff", "180"}}}} 🧪 Debug & Table View Debugger Output: Shows executed commands with color-coded status. Table Header: Displays system info, sunrise/sunset, home/vacation mode, system traffic. Columns: Device type, ID, name, battery status Criteria evaluation Alerts and elapsed time Action tables and active rules 📊 Top Active Monitor (New) AOQ now includes an enhanced Top Active Devices monitor designed to identify devices that may destabilize HC3 performance. It analyzes lifetime activity, current load per hour, and burst behavior to detect devices generating excessive or abnormal traffic. The table highlights devices that may cause delays, radio congestion, disconnects, or even controller restarts. A Peak/h column appears only when abnormal bursts are detected, helping users quickly locate problematic devices without cluttering the interface. 📘 Want to Go Deeper? You can find the full documentation and guides on the Smart Home Forum by FIBARO, including: AOQ Advanced User’s Guide AOQ Quick Guide AOQ HC-WebEye Viewer -

Version 4.0
440 downloads
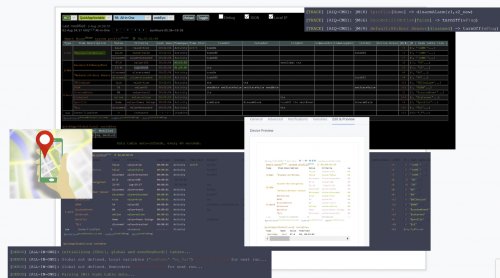
Contributions & credits @jgab - fibaroapiHC3.lua (SDK for remote and offline HC3 development) @10der - Visual Studio LUA environment. AOR – Advanced Offline Remote for Full Control of Your Fibaro System from Your PC AOR brings a whole new level of freedom to Fibaro users. Whether you’re running HC3, HC2, HCL, HC3L, or Yubii, AOR lets you control and automate everything directly from your PC using ZeroBrane Studio or Visual Studio Code. With full LUA 5.3 support, you can finally work without limits: read and write files, run programs on your computer, integrate external systems, and build your own advanced automation logic — all from one place. And yes… even HCL users can now enjoy real LUA scripting without block scenes or restricted virtual devices. No migration, no master/slave setup, no headaches. Easy to Start Download AOR_ZB.txt for ZeroBrane Download AOR_VS.txt for Visual Studio Code Just rename the file to .zip, extract it, and you’re ready to go. Smarter Alerts, Better Awareness AOR includes built‑in Text‑to‑Speech support, so your PC can speak alerts out loud. Stay aware of important events instantly — no matter what you’re doing. Designed for Complete Home Awareness AOR automatically recognizes everything across your controllers: Z‑Wave devices ZigBee devices Nice devices QuickApps LUA and Block scenes Global variables Keywords You can monitor, control, and automate devices across multiple controllers — all without adding any load to your Fibaro hubs. Just keep your PC awake and let AOR do the rest. Powerful Monitoring Scenes stuck? Devices not reporting? Variables frozen? AOR keeps an eye on everything and notifies you the moment something stops behaving as expected. You’ll know about issues long before they become real problems. Advanced Control Logic Create powerful automations that react instantly to: Device states Value changes Time conditions Calculations Custom rules Turn lights on across controllers, trigger actions based on motion, run your own LUA functions — AOR gives you full creative freedom. Your Own LUA Functions, Fully Supported Want to run your own code when something happens? AOR can call your custom LUA functions and pass values directly to them. It’s automation exactly the way you want it. For more details please download AOR Installation AOR Advanced User’s Guide - complete instructions and information AOR Quick Reference Guide – syntax format reference and examples AOR User functions – write your own code. GPS User Guide - location functionality Microsoft Visual Studio debug console ZeroBrane console output Web view- 1 review
-
- 1
-

-
- aor
- all-in-one
- (and 2 more)
-
While Fibaro devices seen in Alexa, but no sensor is included. In addition, Fibaro devices cannot trigger any Alexa's routine. By the way same issue with Google home. Here is the answer and current status with Fibaro skill. Short answer: Fibaro HC3 sensors don’t appear in Alexa because the official Fibaro Alexa skill only exposes basic device types (like switches, dimmers, and scenes), while sensors (motion, contact, temperature, etc.) are not implemented in the Alexa Smart Home API for Fibaro HC3. This is a limitation of the integration, not of Alexa itself. 🔎 Why HC3 sensors don’t show up in Alexa Skill limitations The Fibaro Smart Home skill for Alexa was designed mainly for lights, plugs, and scenes. It does not publish sensor capabilities (motion, door/window, temperature) to Alexa’s cloud. As a result, Alexa cannot “see” those devices, even though they exist in HC3. Alexa Smart Home API requirements For a sensor to appear in Alexa, the manufacturer must implement Amazon’s Sensor APIs (e.g., Alexa.MotionSensor, Alexa.ContactSensor, Alexa.TemperatureSensor). Fibaro has not added these interfaces to their HC3 Alexa skill, so Alexa ignores those endpoints. Z‑Wave vs. Alexa compatibility HC3 is a powerful Z‑Wave hub, but Alexa doesn’t natively understand Z‑Wave. Alexa only knows about devices that the Fibaro skill explicitly exposes. Even if HC3 recognizes a Z‑Wave sensor, Alexa won’t unless Fibaro’s cloud integration passes it through. Community reports Users on Fibaro’s own forums confirm that Alexa discovers no HC3 sensors, only switches and scenes. This has been a long‑standing request, but Fibaro has not expanded the skill to cover sensors. ✅ Workarounds Use Fibaro → Home Center → Alexa scenes You can create a scene in HC3 that reacts to a sensor (e.g., motion detected → turn on light). Then expose that scene to Alexa and trigger it by voice. Downside: Alexa still doesn’t “see” the sensor itself, only the scene. Bridge through another hub If you connect your Fibaro sensors to SmartThings, Hubitat, or Home Assistant, those platforms can expose sensors to Alexa (because they implement the Sensor APIs). This adds complexity but gives you full Alexa automation. Wait for Fibaro skill updates Fibaro would need to update their Alexa skill to support sensor APIs. Until then, sensors won’t appear natively. The question if Fibaro team is working to provide a solution for this well-known limitation? It’s not just about technical capability — it’s about market positioning. I think by exposing sensors through Alexa’s Smart Home APIs (or Google Home), they’d suddenly become far more attractive to mainstream smart home buyers who want plug‑and‑play convenience.
- 7 replies
-
- 3
-
-
- google home
- cag014
- (and 1 more)
-
Is anyone has succeed to use https connection? I did follow Fibaro's procedure to install certification Download the certificate. In the Windows Start menu search for mmc app and open it. In the MMC (Microsoft Management Console) app go to File > Add/Remove Snap-In. Add Certificate Snap-in: Certificates > Select “Computer account” > Next > Next > OK. Now go to Certificates > Trusted Root Certification Authorities and right-click on “Certificates” Import the certificate. Find the certificate downloaded from the FIBARO Home Center 3. Import it. Done. Your connection with the gateway is now secure. but doesn't work on FIrefox. (Expiration date ?) Any extra steps required to install certification? Interesting it does work with Chrome !!??


-
Version 4.0
753 downloads
Purpose HC-WebEye is designed to enhance debugging for Fibaro smart home controllers (HC2 and HC3), especially when dealing with scenes that output HTML-formatted debug data. Since HC3 no longer supports HTML in its debugger, this tool provides a full-screen alternative for better visibility and interaction. 5.23.1🔧 Key Features Feature HC2 Support HC3 Support Notes Display scene debug info ✅ ✅ HC3 filters by tags/levels Start scene ✅ ✅ VD debug info & button press ✅ ❌ Global variable display ✅ ✅ QApp debug info ❌ ✅ Clears HC3 debugger window QApp variable display ❌ ✅ QApp toggle & button press ❌ ✅ Toggle switches ON/OFF 5.23.2🌐 Browser Compatibility Works with Firefox, Chrome, and Edge browsers Requires CORS to be disabled (a separate script is provided for that) Login Prompt You'll be asked to log in on first use. Credentials are not stored for security. Interface Flow Select controller (HC2 or HC3) Choose item type (Scene, VD, Variable, QuickApp) Pick specific item from list Press Reload to fetch debug info Optional: Check "debug" to view API commands 🧪 Interaction Examples Scene selected → “Start” button appears VD selected (HC2 only) → Button list + “Press” button QuickApp selected (HC3 only) → Button list + “Press” and “Toggle” buttons Variable selected → Current value displayed If you're planning to use this with advanced scenes like the All-in-One Scene /QA or Z-wave monitor, this tool is practically essential for visibility and control. -
If you encounter issues such as slow responses or disconnections with ZigBee devices, particularly after a firmware update or backup recovery, try this suggested fix: Start the "Add Zigbee Device" process and let it run for about a minute or until the hub stops it. You might need to repeat this process a few times to stabilize the communication. I personally run this process automatically every three days to maintain stability. Please note that some problems might not be related to HC3, such as issues caused by distance or faulty devices. I'm curious if this works for others, so feel free to share your experience. Thank you!
-
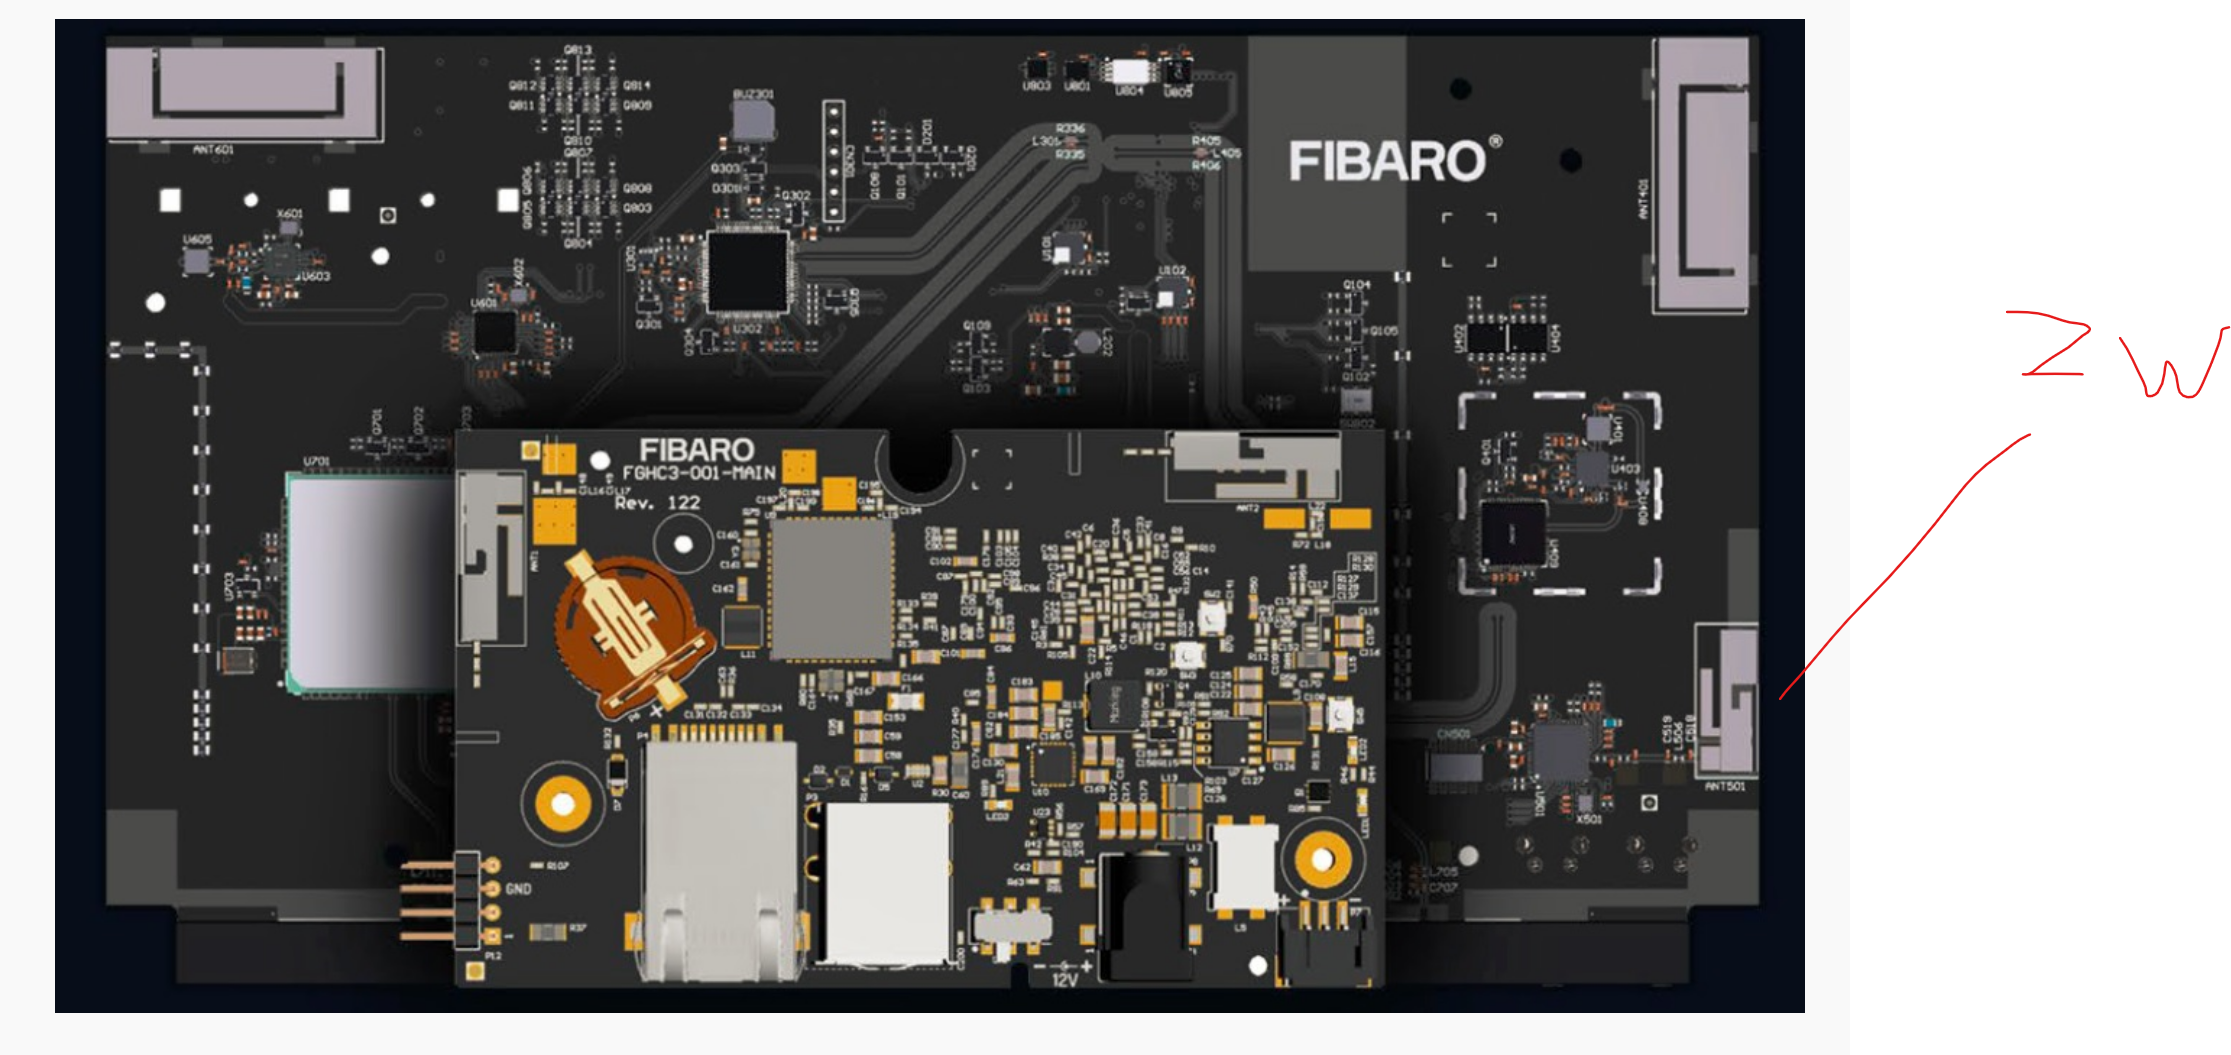
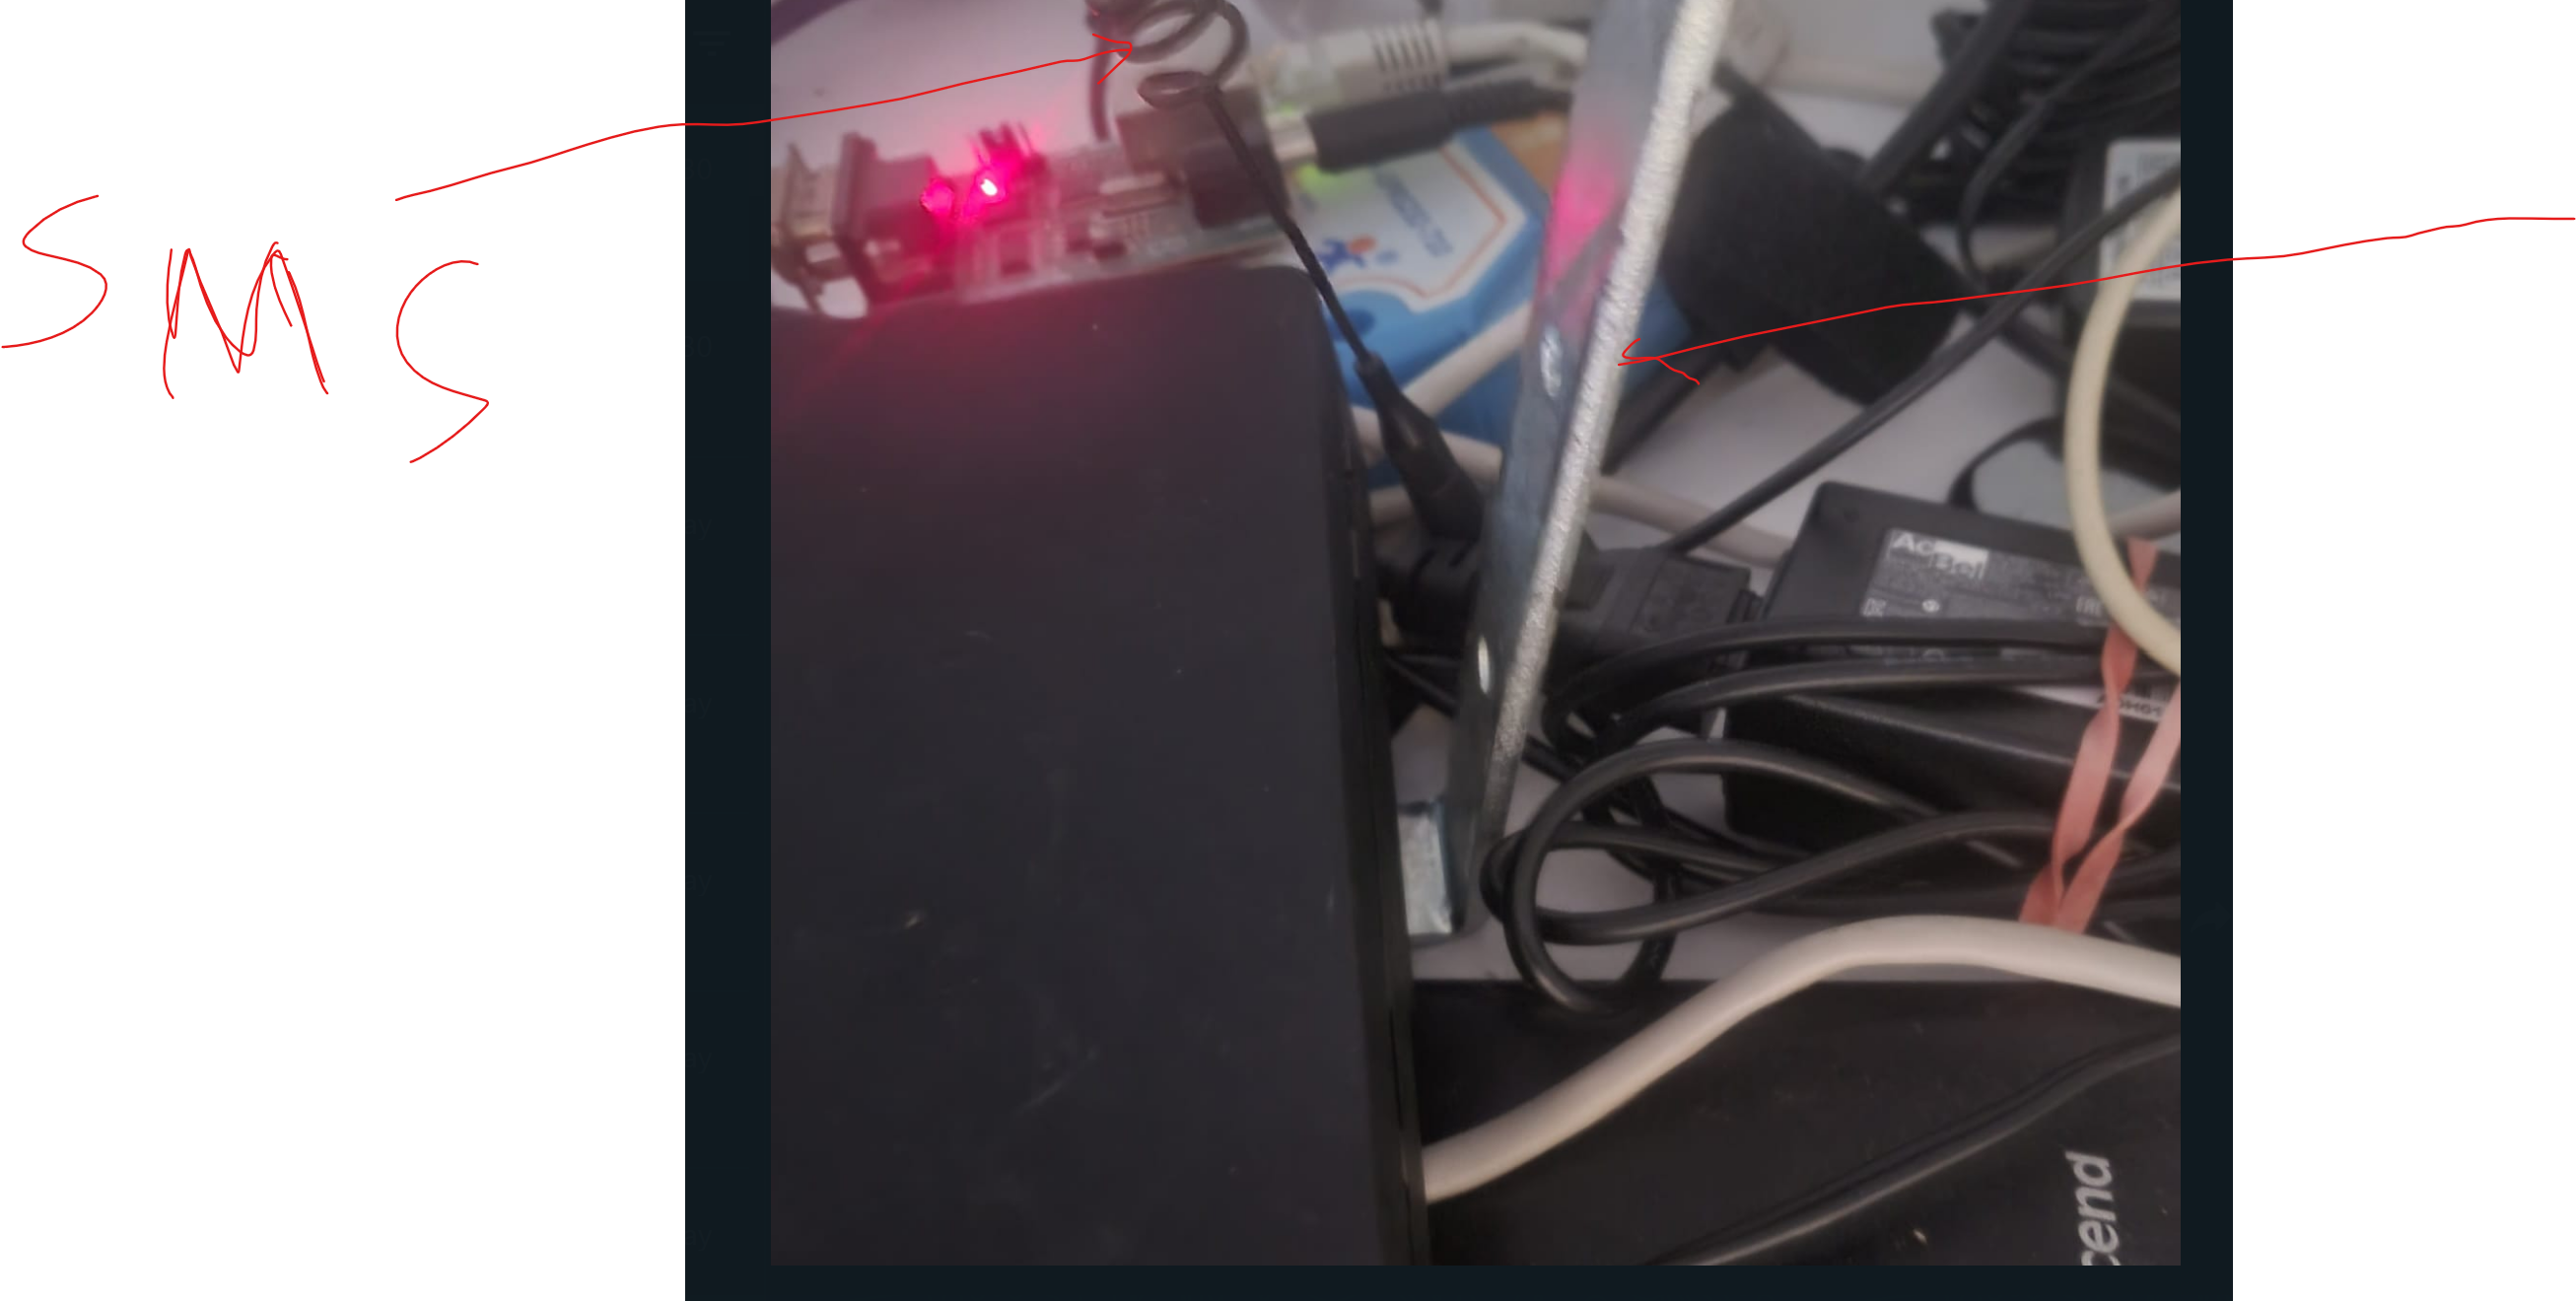
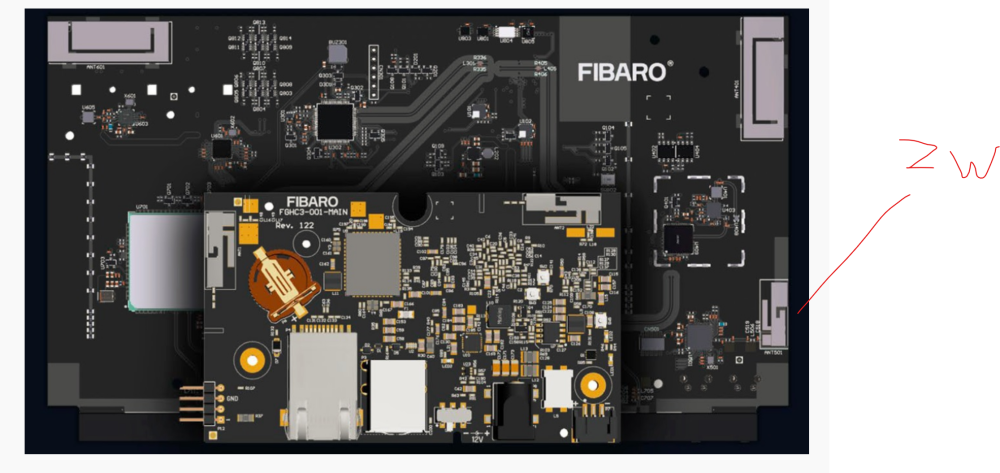
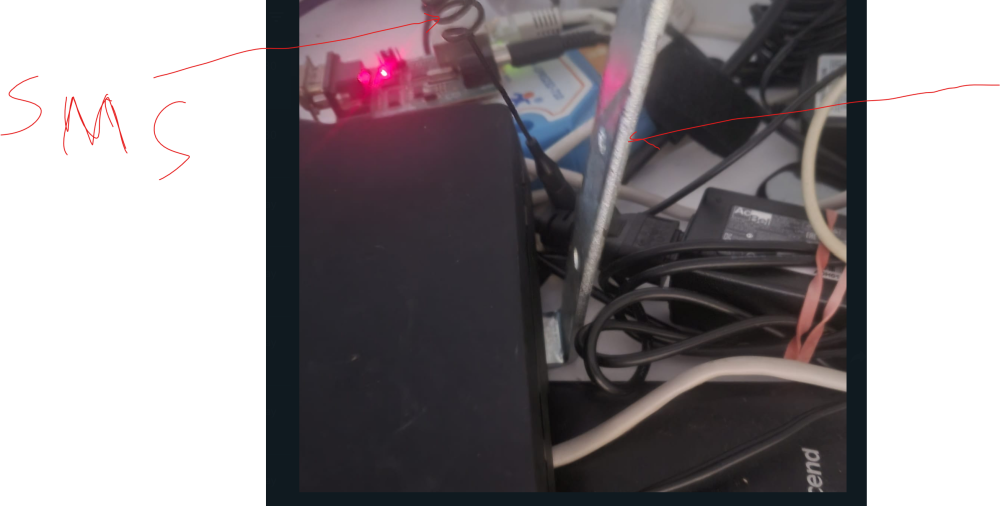
I had an issue with some Z-wave devices that insists to be disconnected from HC3. Have tried to relocate HC3 (as much as possible w/o irritating my wife) without success, always had some disconnected devices. But during the relocation have noticed that in some specific spot all devices have been connected. The problem to achieve full coverage, requires accuracy of ONE millimeter! Have tried to understand, why? I have my own SMS system connected to HC3 and when a specific corner of HC3 has touched the antenna (accidently) I have a good coverage. So.... I took a piece of metal and actually stuck it under HC3 like antenna (see below), now I have an excellent coverage. It's sound like a joke, but it's not a joke at all. After that have found an image of HC3 board, and YES, the Z-wave antenna is actually located on that corner of the box. Of course, will try to get a proper 868Mhz antenna to attach instead of current solution, but hey! it does the job. By the way did the same for Zigbee antenna also and again, a good improvement. There is a good logic behind that. Since HC3 has internal on-board printed antennas, any piece of metal could work as extender. Of course, it should be placed correctly otherwise it will cause interference. Let's say it's like wireless charging that we are using daily for our phones, as you know you should place the phone in very specific area. Here the actual image (please forgive me for the mess, the cost of moving the equipment around) In addition, I recommend using Z-wave repeater NEO Coolcam Z-Wave EU Repeater Sensor Compatible Zwave System 700 Series Home Automation - AliExpress It does work very well (not like AoenLabs extender which always shown as unconfigured device on all Fibaro systems). This extender configured and all parameters could be defined. Best repeater I ever had. I am very curios if it helps to others... please let me know if it works for you too.
-
Version 1.0.0
283 downloads
Sending Text-to-Speech message from your Fibaro hub to Alexa devices and Alexa app on mobile phones (Android and iOS). Give a voice to your smart home. Alexa on your mobile will speak all messages/alerts or any other monitoring messages that you need to know at real time. You will know real time what happens, wherever you are.... (internet connection requires) The QA uses 3rd party "Voice Monkey" skill for free. You are just a few minutes away to make your home speaks.📣🔊 The provided QA is an open source and feel free to change it per your requirements. -
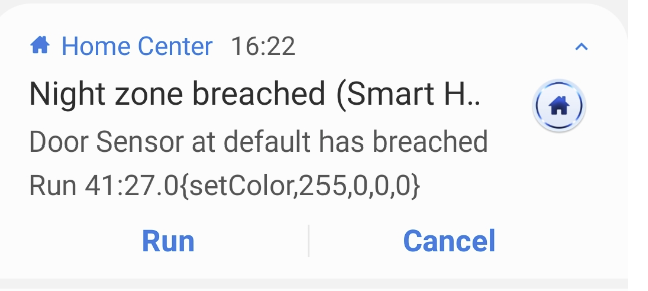
Alarm Control HC3 new alarm concept could be used very efficiently by AOQ: For example: Assuming we have defined "nightSleep" which includes 1 doors and 2 window sensors. The zone is activated during the night (23:00~06:30). When the zone has breached we can send notification and/or send notification for breached device. When sensor has breached it will stay in breach mode and not monitored by alarm anymore, so additional breach is not identified. In order to monitor all sensors again, entire zone must be re-armed. Here is an example how to do it: jS2n={door=300, wSense1=410,wSense2=420, rgb=500} jM={ {0,"$blank",{timeSlot="06:30~23:00,23:00~,~06:30",initAct={"nightSleep","disarmAlarm",""}, trueAct={"nightSleep","armAlarm",""},falseAct={"nightSleep","disarmAlarm",""}}}, {0,"`door`|`wSense1`|`wSense2`",{state="alarm=breached",trueAct={{"Night Sleep Zone breached","sendEmail","$name at $room has breached"}}}}, {0,"$nightSleep",{state="value=breached",trueAct={{"nightSleep","disarmAlarm",""},{"nightSleep","armAlarm","5"}}}}, If you need visual indication of alarm status, we can add trigAct{} to set RGB Bulb according to alarm state by change last line as following: jS2n={door=300, wSense1=410,wSense2=420, rgb=500} jM={ {0,"$blank",{timeSlot="06:30~23:00,23:00~,~06:30",initAct={"nightSleep","disarmAlarm",""}, trueAct={"nightSleep","armAlarm",""},falseAct={"nightSleep","disarmAlarm",""}}}, {0,"`door`|`wSense1`|`wSense2`",{state="alarm=breached",trueAct={{"Night Sleep Zone breached","sendEmail","$name at $room has breached"}}}}, {0,"$nightSleep",{state="value=breached",trueAct={{"nightSleep","disarmAlarm",""},{"nightSleep","armAlarm","5"}}, trigAct={{"`rgb`","setColor,255,0,0,0","","{$nightSleep:value=breached}"},{"`rgb`","setColor,0,255,0,0","","{$nightSleep:value=armed}"},{"`rgb`","setValue,0","","{$nightSleep:value=disarmed}"}}}, You can use sendEmail, sendPush or sendiPush notification. Note: Using sendiPush you can define to execute scene or an action on any device (and any command) in the system. By pressing "RUN" button on iPush notification you can do follow: {"Night Sleep Zone breached","sendiPush,run_30","$name at $room has breached"} run scene 30 {"Night Sleep Zone breached","sendiPush,run85{turnOn}","$name at $room has breached"} turn ON device 85 {"Night Sleep Zone breached","sendiPush,run90{setColor,255,0,0,0}","$name at $room has breached"} set red color on device 90
-

Version 3.0
3,744 downloads
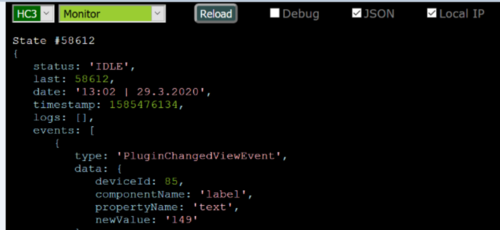
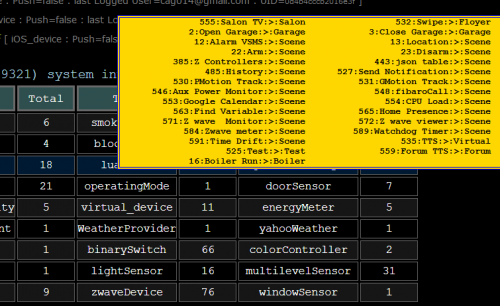
This scene monitors and catches Z-wave commands traffic between controller and devices. The data displayed to user as a table which includes total commands and their properties per device, in addition same data displayed at graphical chart and shows system activities over the time. Since Z-wave protocol is not a fastest one (in many case it's just freeze) this code helps to analyze the data and to take necessary actions to reduce overall Z-wave traffic and system load. Scene functionality 1. This is not an auto started scene. You need to start it manually. While the scene is running, you can switch views between table/chart and monitor (follow instructions on screen). 2. User configurable parameters are: gVar = true-- Create and use global predefined variable. The scene could work with local table as well, but by using global parameter you can keep history of the traffic. It very helpful when you're updating the system to new release, to compare Z-wave performance. In case you have decided to use global variable, copy the data to other variable to keep the history. To view data of saved variable please download and use Z-wave Viewer scene. Z-wave Viewer could be executed in parallel to Z-wave Monitor as well (when using global variable only) logRate = 5 -- Time rate in minutes to log Z-wave activity. Used as axis X scale in charts view. Reasonable value 5 to15 minutes for 24 hours of monitoring. In case to achieve better resolution the value could be decreased down to 1 minute. time2monitor = 6 -- Time-slot in hours to monitor z-wave traffic, after that time, table and chart will be displayed on debug window and scene will stopped. Value of 0 hours disables auto ending. User needs to stop the monitoring. If less than hour monitoring required please use decimal fraction. For example to set monitor time to 15 minutes set, time2monitor = .25 markId = "|0|0|", " Cyan" -- Devices (IDs) list and text color to display specific devices in defined color at monitor view for follow up purpose. In few cases you need to monitor specific device, so fill-in the device ID and it will be highlighted by different color from other devices. deadOnTop = {true, "maroon"} -- Display DEAD devices on top of the monitor view list in defined text color. Since we're not always looking on the screen, so in case the system will identify dead device it will continuously display the device (in red) on debug window. All variables below are the same for Z-wave Monitor and Z-wave Viewer chartHeight = 100 -- Chart height in percents (%). Chart's default height fits debug window. The variable changes height of all charts (devices.scenes and events) chartWidth = 100 -- Chart width in percents (%). Chart's default width expands according to number of samples. User could expand the width to get better detail view or to stretch to visualize the load on time axis or to take snap shot of entire time line. The variable changes width of all charts (devices.scenes and events) topDev2disp = 6 -- Number of most active devices to display on devices chart. If set to zero chart won't be displayed. topScene2disp= 10 -- Number of most active scenes to display on scenes chart. If set to zero chart won't be displayed. darkSkinMode = true -- Charts display skin mode. Set false for light (white) skin. dev2review={false,"|470|804"} -- Generate chart for every device in list of actual device readings over the monitoring time. For devices with two results (like power and energy) both reading will be displayed. On left and right sides of the chart applicable scale displayed. Please note, no chart is generated for devices like motion, door and any other sensors, which provide values of true/false. userDev={false,"|504|_531|"} -- User defined devices and scenes IDs to generate specific combined chart. Please write underscore before scene ID |_531| stackedChart=true -- A stacked line chart is an line chart in which lines do not overlap because they are cumulative at each point. Set to false to view standard line char. All charts except ZKG chart (events,CPU and RAM) will be displayed according to this variable. Brief explanation what is displayed: 1. Monitor view This snap shot includes top and dead devices marked in different color from other devices. Two main sections in this view: Header 1:08:07/ 6:00:00 1824 events/77 devices event/2.3s (Click Start for ) Elapsed Time/Monitoring time Number of Z-wave events/devices Z-wave traffic rate Click to switch to table/chart view Devices list Every device displayed at follow format - #2/34TV509@Salon(216.7 power) #2/34 -First number is number of events during logRate slot. Second number is total number for events so far. TV509@Salon - device name, ID and room name (216.7 power) - actual reading and reading property 2. Table view total # - number of total Z-wave events on device total % - Percentage of device's events of total system Z-wave events. All yellow marked headers are received Z-wave properties, except two properties, dead and deadReason which are marked in red. For each device displayed the total number of this specific properties. Red marked ID, means that device was or is "dead" By hovering mouse over device IDs, device and room names will be display (tool-tip) at popup box. At the end displayed few extra summaries Elapsed time and Start-End timestamps Sample log rate as defined by user. Total samples during monitoring time Total Z-wave events and total number of active devices Average Z-wave traffic rate Z-traffic range. Shows the highest and lowest z-wave activities during monitoring time. If dead devices have found, list of them is displayed 3. Most active devices chart This chart shows events number of most active devices ( up to number of all active devices allowed by setting topDevNum variable ) on monitoring time-line. On the right-upper corner displayed ID, name and room of the device. By hovering mouse on diagrams or legend, selected item will emphasized in bold to make the item more visible. 4. Most active scenes chart This chart shows triggers number of most active scenes ( up to number of all triggered scenes allowed by setting topDevNum variable ) on monitoring time-line. On the right-upper corner displayed ID, name and room of the scenes. By hovering mouse on diagrams or legend, selected item will emphasized in bold to make the item more visible. 5. Review device's actual readings - (dev2review) For devices with two results (like power and energy) both reading will be displayed. On left and right sides of the chart applicable scale displayed. This chart most useful to identify if device configured to send reports interval at high rate and " differ in readings to send report" set to very low value. By hovering mouse over the chart, will scale down the diagram to make visible entire range. In case the horizontal scrollbar is not in the middle of the chart , the diagram will flicker. 6. User defined combined chart In some cases we need to inspect behavior of some devices and scene that triggered by the device. This chart shows user defined devices and scenes on monitoring time-line. On the right-upper corner displayed ID, name and room of the scenes and/or device. By hovering mouse on diagrams or legend, selected item will emphasized in bold to make the item more visible. 7. ZKG Chart View Chart view shows Z-wave traffic and system load on time line (based on logRate value). You actually could see your smart home beating heart (like EKG). I have named as ZKG (Z-wave cardiogram). Now it's possible to see the "rush" and "quiet" hours of the system. Chart view includes 5 diagrams displayed over time-line of monitoring period. The diagrams are: Z-wave events Triggered scenes CPU1 percentage CPU2 percentage RAM percentage At top-right corner of the screen, displayed legend of the diagrams and colors. Events total number in same color as a diagram line. CPU1 min > avg < max in same color as a diagram line. CPU2 min > avg < max in same color as a diagram line. RAM min > avg < max in same color as a diagram line. Triggered scenes total in same color as a diagram line. Most triggered scene ID and scene's name in same color as a triggered scenes In case dead devices have found during the monitoring period, the time stamp where it happened will colored red and at the top of the screen, directly above the time stamp, dead device(s) ID displayed. Axis Y has two scales. Left scale represents occurrence numbers of Z-wave events and triggered scenes. Right scale is a percentage and it related to CPU1, CPU2 and RAM measured values. By hovering mouse on diagrams or legend, selected item will emphasized in bold to make the item more visible. I'm strongly advising to use global variable and to view the data using Z-wave Viewer in parallel to Z-wave Monitor The idea behind, that you can change parameters to view different devices/scenes on the fly. By changing user configurable parameters in Z-wave Monitor you'll need to start the scene all over again. Note: The debug text of these scenes is very big, so If you're using Clear Debug scene, please remove these scenes from the list. Please let me know if extra info is required. Please report if any bug occurred. -

Version 1.0.0
284 downloads
Attached Quick App. enables your Fibaro hub to control all 3rd party devices integrated into Alexa using Voice Monkey skill. Now you can control your smart devices like Air Conditioners, Hue devices, Dishwashers, TV, Washing machine and etc. Let's take our smart home functionality to the next level HC2/HCL users can use HTTP to achieve same command and control. See HC2/HCL section in Alexa Triggers.v1.pdf All-in-one QA (AOQ) supports Alexa triggers also. Any feedback will be appreciated -
Version 1.0.0
1,407 downloads
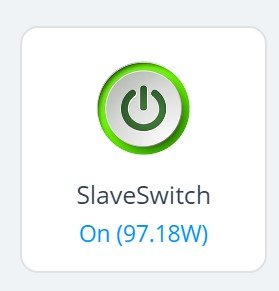
Those QuickApps intend to use as a slave devices on HC3 to emulate original devices on HC2/HCL or secondary HC3. The main purpose is to emulate devices of HC2 controller to create same environment on HC3 before migrating the devices. You can use these devices as standard HC3 devices in Lua, block scenes and QuickApp (triggers and control). After migration you just need to delete slaves and change device IDs in code. To make it easy, recommended to use json Home Table. In addition if you intend to keep HC2 or HCL as part of your Home Automation, these slaves provide an option to run your system on HC3 only. You can expand your HCL usage by using Lua, block scenes and QA on HC3 to control and monitor devices on HCL. Please use slaves according to device functionality. For sensors use SlaveSensor, for dimmers use SlaveDimmer, for RGBW dimmers use SlaveColor or SlaveColorW (option to change white level). It's very important to use correct KeyFob slave (sceneActivation or central Scene) After downloading the QA, open user_data file and enter credentials, IP and device ID. slaveRate value is in milliseconds and determines the time rate to fetch the data from original device. For example if device on HC2 turned ON, within 700 milliseconds the slave device on HC3 will be turned ON also Every slave device has an option to stop/start emulation by pressing toggle button . -
HTTP request crashes frequently on HC3L showing below message: Unknown error occurred: LuaEnvironment: /data/vendor/avhttp/avhttp/impl/http_stream.ipp:2312: void avhttp::http_stream::handle_skip_crlf(const MutableBufferSequence&, Handler, boost::shared_array, const boost::system::error_code&, std::size_t) [with MutableBufferSequence = boost::asio::mutable_buffers_1; Handler = boost::function; std::size_t = unsigned int]: Assertion `crlf[0] == '\r' && crlf[1] == '\n'' failed. Have tried many options to catch what exactly is the problem, without success. Is anyone having same problem?
-
Hi all, I see that some users have downloaded Z-wave monitor script and I think it could be a good idea to share our data and know-how to optimize our Z-wave performance. In my case I have manage to reduce Z-wave traffic from average of event per 1.7 sec. to 4.8 sec (24 hours monitoring, 78 physical devices, 382 IDs), but I don't know if this is a good number. It will be interesting if anyone could share an average of his system. That way we can compare and might be to achieve the right number and stable performance which may be could prevent Z-wave freeze in the future. I think average of Z-wave traffic somehow depends on number of the devices in the system and again I believe we need team work to find correct formula for that. Few users have shared with me that they have found devices, which "bombarding" the traffic with unnecessary reports and they fixed the issue. It could be very helpful to all of us to share our solutions and fixes... we all can learn from others If you think it could violate your privacy, please ignore this message... Thank you
-
I'm wondering if there anyone wants to test All-in-One (same as HC3) running ON PC to control HCL with an option to write Lua functions also. (Including http requests)
-
Version 2.2
1,330 downloads
Several times I've got lost in my system to identify specific device. I believe many of us have old devices/scenes that have been hidden or disabled. After a while, finding them again is quite a headache and not an easy task. I have written a scene that shows all existing devices, scenes, users and mobile devices with some extra data of properties. The scene output has two formats: a list of devices by rooms a plain list of all components in acceding order of IDs In order to choose between two formats please change as following: local plainList =false (for list by rooms) local plainList=true (for plain list in acceding order) Since the latest upgrade 4.503 there is a new type of warning "API: not found". So during the execution you might see a lot of messages: [DEBUG] 00:19:26: Gathering system information..... [DEBUG] 00:19:26: [1;31m2018-07-03 00:19:26.358874 [ error] API: Not found [DEBUG] 00:19:26: [1;31m2018-07-03 00:19:26.528578 [ error] API: Not found [DEBUG] 00:19:26: [1;31m2018-07-03 00:19:26.669187 [ error] API: Not found [DEBUG] 00:19:26: [1;31m2018-07-03 00:19:26.826398 [ error] API: Not found .................................................... Please ignore the messages and wait... I hope Fibaro team will fix it on stable release. -
Version 1.3
927 downloads
First of all, I would like to express my sincere appreciation to @10der @Alex @petergebruers @robmac @amilanov @Bodyart @drboss and others for their time and help to improve / debug the code. The scene “analyzes” mesh network configuration in the system and displays the location efficiency of the devices in table format. Table sorted by the rooms according to average location efficiency of the devices in the room (in ascending order - from lowest to highest efficiency). More like "Z-wave mapping" in your residence. In addition scene analyzes location efficiency of HC2 location. To achieve precise data, please make sure your devices' physical location correctly associated with room names. For example: in-wall switch located in kitchen, but controls lights in garden, should be assigned to kitchen and not garden. (the device name should be assigned as garden lights) Usually inclusion of the device done close to HC2 therefore the route table is incorrect. To achieve reliable data, perform inclusion when device located in designated place/spot in residence or perform Mesh Reconfiguration to device after inclusion near to HC2. User configurable parameters,: showDevices=false if set tot true,not sorted table of all devices will be displayed also). fontSize=100 font size percentage (80% - 150%). Big Note: If you've removed device which is part of mesh route to others, the route table doesn't get updated ! Controller continues to maintain undated route table! Mesh table must be reconfigured. (Z-Range Analyzer identifies these devices.) Warning: Battery powered devices cannot forward packets and cannot be used in route for others. To observe data in graphic, use @10der's visualizer. Run the scene and here some details on what will be displayed: When or if corrupted/deleted devices have found in your system, data details will be printed before table appearance. Table header: · Number of master (physical) and slave devices in the system. By hovering mouse over controller name, table color index and Z-Capacity are shown · Date range of displayed data (if any changes done like adding, relocating devices after this date, mesh reconfiguration requires) · HC and devices location efficiency. If devices lack mesh route data (colored by red) present in the system, two efficiency numbers displayed. (50%/60%). including devices with no routes and neighbors data excluding these devices. Table columns: 1. # Script's total serial number / Script's serial number in room 2. Room Name % Room name and average location efficiency of the devices in room 3. Parent ID: Name Parent (master) device ID, name and room. Devices lack mesh route data colored by red. By hovering mouse over, child (slave) devices list is shown (and number of last 24 hours z-wave events of each slave) 4. % Percentage of location efficiency of each device in the room. 5. iSee Total number of neighbors (adjacent) devices that it can communicate with (seen by device). By hovering mouse over, devices details are shown. Great view on how device located by seeing who neighbors are. The data shown in two colors: I. green - Device can communicate directly to controller. Shades of green according to number of adjacent neighbors. greener, more neighbors) II. red - Device doesn’t communicate directly to controller. Shades of red according to number of adjacent neighbors. (redder, less neighbors) If tilde sign appears before the number - means the list includes device(s) that not in the system (deleted device). I devices details menu this device marked grey. 4. Last Route List of devices that participate in route communication to controller. By hovering mouse over list of devices details is shown. 3. iRoute Total number of devices where this device is part of communication route. By hovering mouse over, devices details are shown. 5. Status Last working route status. (OK, pending, in progress, error) 6. Time Stamp Time stamp of last working route reported to the controller. 7. 24History Master's last 24 hours events number and percentage of total events. By hovering mouse over parent in Parent ID: Description column, number of z-wave events for each slave is shown. Please notice 24 hours history based on saved logs in event panel. If you have devices that excluded from saving logs, theirs events are not available. Points for improvement Location efficiency calculated relatively to your best device in system, therefore red and yellow marked devices don't necessary indicates that your system is broken. Special attention requires when changing/removing physical place of devices in location with low efficiency level, it could cause loss of communication or delays. I. Parent ID: Description - Device marked red indicates lack of route data. Perform mesh reconfiguration for this device. If reconfiguration failed, recommended to exclude/include the device (Painful process and occasionally updates in code are required). II. Last Route - More devices in route increase probability of communication delay and indicates that device is in distance from controller. Since in Z-Wave each device calculates the shortest route to the destination (up to 4 hops), therefore if route includes more than three devices recommended Check/verify devices in route as well. Mesh reconfiguration recommended. Device is far away from HC2 or Z-wave signal interrupted. III. iSee - If number is in shade of red and relatively low, means the device located far away from controller and low number of adjacent neighbors in that area or device located where physical barriers such as metal panels, concrete walls and etc. are blocking Z-Wave signal. (or located in-wall socket and Z-wave signal interrupted) Increased probability of packets loss rate, delay expected. IV. iRoute - As much as number is higher, means increased workload for this device (needs to track messages from this number of neighbors). Increased probability of delays from device and routed devices. Recommended number less than five devices. V. Route tables do not get automatically updated by adding a new device or device relocation. Mesh reconfiguration (in Z-Wave Panel) requires. Do not reconfigure mesh network when devices are not in designated spot. -
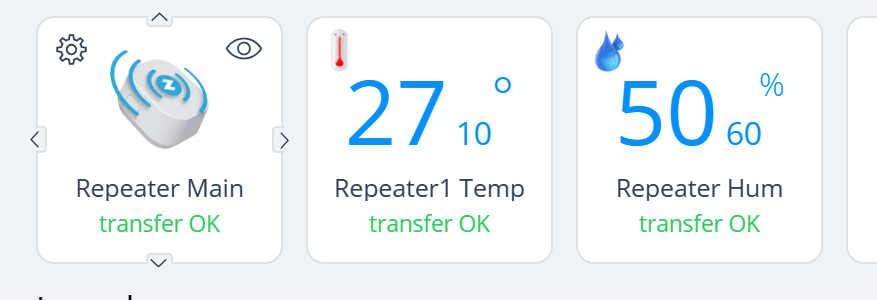
For a long a time I'm looking for efficient Z-wave repeater. Have tried Aeon Labs, DÜWI, Leviton repeaters w/o any success at all. Recently have found Neo coolcam repeater and relatively at low price (~$40 USD). Honestly, I thought it will be a waste of money, but have placed the order anyway. Yesterday I have received and included the repeater, unbelievable it does work!!!! Surprisingly, the repeater installed very close to the controller (a little bit further from devices than controller himself), but devices surrounded by concrete walls now works w/o problems (had many Zwave disconnections with them - dead/wakeup issues). Have no idea how to explain that the controller is closer to devices and doesn't work properly as a repeater. Note: Please exclude devices (which use repeater) from polling or the devices will end up as disconnected. In addition, the repeater has temperature and humidity sensors also. So here is the link... NEO Coolcam Z Wave EU Repeater Sensor Compatible Zwave System 700 Series Home Automation|Building Automation| - AliExpress Please don't ask for refund from me, If the repeater won't work for you. 😁 BTW, have placed an order for two more....👍
-
Since Zigbee devices are cheaper and the range of available devices is much bigger many users start to use them. The problem that not all of them are supported yet and in few cases (at least for me) after purchasing they are not working (partially or fully). Although there is a list of supported ZigBee devices published by Fibaro, but the list doesn't update and in some cases, misleading. So maybe our community could help to each other, by publishing status of ZigBee devices that have been tested/verified by users. Posted link below will open and share Excel sheet of devices and their status. The file is opened for editing to everyone, so please use that authorization carefully and fill in correct data. Please include not supported devices also, to avoid unnecessary expense for others. Let's see if it works for us... https://docs.google.com/spreadsheets/d/1xNO2wlPstKksaScTWiRjueqdDeHrNkxttEy8muc_8So/edit?usp=sharing
-
Version 2.0
613 downloads
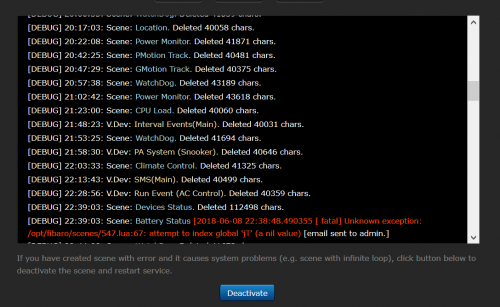
I have noticed that sometime scenes or virtual devices stuck without any visible error. Another observation, that when it happens I cannot see debug information/messages of the scene/VD. In addition the Chrome browser crushes - Ah, Snap. The idea behind this scene is to monitor debug text of all scenes and virtual devices (including all buttons, sliders and etc.) in the system. In case the length of all messages over 40.000 characters, the scene clears the buffer. Since the code already reads debug messages, it checks the last message and if there is an error message (scene or virtual device) the code sends email to administrator with an error description. Note: In case of error the messages are not deleted! The purpose of that is to keep the error for user review and debugging. Currently this scene runs every 300 sec. (5 minutes) . In order to set different time, please change sleepTime variable. (sleepTime = xxx) By default scene clears debug buffer over 40.000 characters. In order to set different default length, please change txtLen variable. (txtLen = xxxxxx) In addition you have an option to set max. debug buffer length to any size for any scene or virtual device and its buttons. To do so please update txtLenTbl table as follow: Since the system could use same ID for VD and scene, this table has two elements of arrays, VD (vdLen) and scene (sceneLen) local txtLenTbl = { vdLen = {{30000,"|618|615b12|515b3|"}, {35000,"|134|163b13|"} }, sceneLen = {{35000,"|25|"},{30000,"|17|545|"} }, } --[[ Vitual Device table elemnt: 1st param. 30000 is the desired buffer length size. 2nd param. "|618|615b12|515b3|" is the list of VD ids and button number separated by "|". For main loop use device ID only, for VD's button use button number same as in fibaro:call(VDid, "pressButton", button_num) function. For example: 618 - means Virtual device id 618 main loop. 615b12 - means Virtual device id 615 button number 12. Scene table element: 1st paraam. 35000 is the desired buffer length size. 2nd param. "|34|25|" is the list of scene ids separated by "|". You can defined as many arrays as needed. --]] The scene designed to run automatically, so please set "Max. running instances:" to 3 and "Run scene:" to automatic. . When the buffer cleared, the name of that scene/VD will be displayed at scene's debug window. This code should find all scenes and Virtual devices (including all buttons, sliders and etc.) at the system. To make sure that everything has found at your system, please press "Start" button to run second instance of scene. This "one-time" instance will be executed without loop. Means only one instance of automatic loop could be exist. After second instance execution you should see on scene's debug window printout of every scene/VD/VD button. its current buffer length size and max. allowed buffer size. Since this code runs in my system I didn't get any stuck issues and has successfully caught few unexpected errors in the scenes and VDs. I don't know if it somehow related to system freeze problem, but since this code runs I don't have system freeze or any CPU overloads. Hope it helps... -
Version 9.6
4,185 downloads
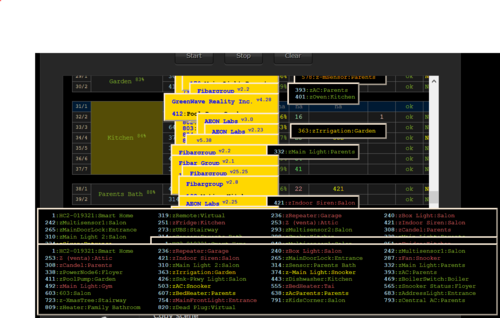
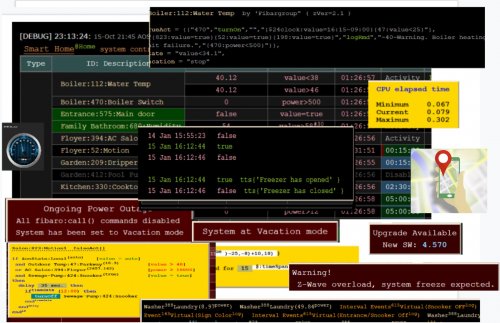
This script is designated to control and monitor your home system. Script automatically identifies the type of elements in the system. (Z-wave device, virtual device, scene, automatic scene (Block, Magic or Lua). Any valid Z-wave device property and his value could be monitored, controlled and execute commands accordingly. If you don’t want or need to use this script, but have issues with your system (like delays, z-wave devices don’t respond always, scene receives no triggers), it helpful to run this scene as is (without any changes) just to monitor and to identify z-wave “dead” and/or NACK occurrences in your system. You’ll receive on-line notifications about it. The first time you use All-in-One Scene, you will need to define jM {} hash table. Each line in table has two mandatory and two optional fields. jM={ { 15, "137|630",{timeSlot={“12:00~18:00”},state="value=true", trueAct={“|230|”, “turnOn”,””}}} } time span IDs list Criteria & Rules Action tables a) time span a period of time (in minutes) within which some activity must be performed by device or scene. Additional two option could be defined: I. time span = 0 defines the line as activity only. II. time span = ‘negative number’ line is suspended (remarked) b) IDs list given list of devices/scenes/VD/global/keywords. Use under score for scene IDs. (“_45”). a) global variable – add an ampersand sign & to global variable name: &varName b) keyword – add a dollar sign $ to keyword variable: $name Note: To use & and $ characters for other purpose , add % after the character. c) Criteria & Rules (optional) property, state, time slot, vacation mode… d) Action tables (optional) tables of commands to be executed. By defining String-to-number table which converts device name to ID jS2n= {boiler=137, dryer=630} jM{} above table will look like, device name must be included within back apostrophe sign. jM={ { 15, "`boiler`|`dryer`",{timeSlot={“12:00~18:00”},state="value=true", trueAct={“|230|”, “turnOn”,””}}} } 1. Monitor option There are so many times that scenes or Virtual devices are stuck w/o any understandable reason. Some devices suddenly stop to send reports or don’t change state. In most of the cases we don’t aware about the problem till something goes very wrong. The monitor option will send an alert in case of defined states are timed out. Note: In order to monitor virtual devices, fibaro:log() command must be included in main loop or in button’s code. For example, just add fibaro:log(“done”) at end of your main loop and VD could be monitored. Example to set watchdog timer for devices, scenes, virtual devices, global variables and keywords jM={ {8, "_17|_545",{timeSlot=”10:00~22:00”}}, -- within every 8 min. between 10am to 10pm, scenes 17, 545 must be active. If not alert sent. {3,"134|618|_556|_588"}, -- within every 3 min. devices 134,618 and scenes 556,588 must be active. If not auto-alert sent. {10,”132|145”,{property=”power”}}, -- within every 10 min. devices in list must report new power value. If not auto-alert sent. {5,”112”,{state=”value=true”}}, -- if device’s value is true over 5 minutes, auto-alert sent. (e.g. device stuck in breached state) {30,”470”,{state=”power>10”}}, -- if device’s power greater than 10 over 30 minutes, auto-alert sent. {20,”&HomeStatus|$iDoor”}} -- if global variable HomeStatus or keyword iDoor didn’t change within 20 min., auto-alert sent. 2. Control option This part of the script enables execution of actions based on device state or value changes. Script supports many options, calculations, time modifications, if statement and other features to do almost everything that you need to control your home just with one scene (which even doesn’t trigger by the system). Six action tables could be defined: (See AOS Advanced User’s Guide for more information.) trueAct{} - executed when state status is true. Please do not confused between state and value. If state defined as “value=false”, state status is true when value of device is false. falseAct{} - executed when state status is false. Please do not confused between state and value. If state defined as “value=false”, state status is false when value of device is true. trigAct{} - executed on every value change at any mode, true or false timeoutAct{} - Disables auto-alert notification and executed when elapsed time exceeds time span. Time span counting restarted after state status back to true. timeLoopAct{} - Disables auto-alert notification and executed when elapsed time exceeds time span. Time counting restarted immediately even if status remains true (no back to true change required). InitAct{} - Set of specific actions to be executed on startup only. Here is an example of most common wanted scenario, to turn on light when motion sensor breached and turn off light when sensor back to safe after few minutes (3 min. in this example) jM={0,”`mSensor`”,{state=”value=true”,trueAct={“`lightSw`”,”turnOn”,””},falseAct={“`lightSw`”,”turnOff”,”180”}}} Since no need to turn on light during the day, timeslot could be defined jM={0,”`mSensor`”,{state=”value=true”,timeslot=”18:00~07:00”,trueAct={“`lightSw`”,”turnOn”,””},falseAct={“`lightSw`”,”turnOff”,”180”}}} But now could be an issue to turn off the light, if sensor breached few seconds before end of timeslot and back to safe out of time slot, falseAct{} table won’t be executed. In this case, turning light off should be part of trueAct{} table jM={0,"`mSensor`”,{state=”value=true”,timeslot=”18:00~07:00”,trueAct={{“`lightSw`”,”turnOn”,””},{“`lightSw`”,”turnOff”,”180”}}} Same Z-wave device, global variable and keyword could be defined at several lines (no limit). Scene and Virtual devices could be defined one time only. Please download 1. AOS Advanced User’s Guide - complete instructions and information 2. AOS Quick Guide – syntax format reference and examples 3. AOS HC-WebEye Viewer Guide - AOS browser viewer guide 4. timeDrift – If you considering to use time drift correction, please download this scene and follow instructions at header. Script Advantages: No Lua or any software knowledge required. Supports time drift correction. (download timeDrift scene) Supports vacation and power outage modes. Provides excellent view of all devices, global and keyword variables at a glance, including: status, current value, up to 20 last values & executed commands. (Defined by dataRecord variable) Each command to be executed with current variable values is shown All items displayed by their names, including VD buttons in human readable format (not just IDs) At the bottom of the table up to 50 last commands in execution order are displayed (defined by cnnLine variable) Commands executed much faster than using system’s standard triggering mechanism (Lua, Block or Magic) No limits of scene’s “Max. running instances” Complex operation could be executed by newbie users (like experts). Anti-ripple delay could be applied. (change status after specific delay according to latest value) Actions could be executed by/from Scenes and VDs. Add/Change/Suspend any action in few seconds of work. Z-Wave traffic always monitored and summary of the traffic displayed. Dead and NACK occurrences of entire system immediately reported, recorded and notification sent to user. Repeated commands and device’s reports (RPT) of entire system are recorded and displayed. Global variables names, elapsed time from last change and their current values are shown. (Variables used in table) Details of all actions and commands are displayed in popup menus. Keeps Z-wave traffic low as possible by verifying device state before sending command. If device ID changed (excluded/included), user needs to update device ID in one place only! No extra jSON tables. Keeps your RAM load low All data displayed as a table where all configured devices and their related data displayed in human readable format. Extra button 'Refresh' will appear and covers 'Clear' button. Press ‘Refresh’ or ‘Start’ buttons to refresh table data. Table's header includes: startup time stamp, script current version, scene Name, LED as displayed at HC2 front panel, sunrise/set hours. System name – by hovering mouse over, system inventory shown Current home mode (@home or @vacation) system status - by hovering mouse over, last system's activities is shown Elapsed time Total Z-wave events - by hovering mouse over summary of all activities shown Min, average and max Z-traffic, by hovering mouse over CPU elapsed time shown By hovering mouse over column headers, quick guide is shown. Quick guide displayed during 5 minutes from startup. On every manual refresh, the guide displayed for next 5 minutes. Table columns are: Type – device type (Z.Device, G. Variable, V.Device, luaScene, blockScene, magicScene, Auto-luaScene, Auto-blockScene, Auto-magicScene). By hovering mouse over Z.dev type column, top active devices are shown. User configurable by setting topActive global variable. (0-30) default 15 ID: Description – room name: device ID: device name. Z-wave devices sorted by rooms, then by device ID. Battery capable device have green background according to current battery level. If device armed, alarm icon appears.By hovering mouse over, inventory of devices in jM{} table are shown. Value – items current value. By hovering mouse over, latest values, trigger value and command executed are shown. Criteria – state of evaluation to determine true or false status. If formula included, the state displayed in Italic fonts and by hovering mouse over, popup menu shows the formula and calculations Last seen – elapsed time since last status change. Alert – by default this column isn’t shown. If any devices have been alerted the column will be shown. Please notice that in some cases the device could be alerted, but after while it could back to normal activity. For example, if motion sensor is breached over specified time-span, alert notification will be sent. But after a while the sensor back to safe and alert is canceled, “back to normal” notification will be sent. At header of alert column shown current number of alerts Time Span – time span to monitor state of items. By hovering mouse over, maximum reached span time shown. If time span set to 0, then this line acts as activity, no timeout alerts reported. If time span set to negative number, this line is suspended and no actions executed. Time Slot – Active time slot range to execute related actions. Timestamp to execute specific action at specific time. trueAct – list of actions to execute when state is true. falseAct – list of actions to execute when state is true. trigAct – list of actions when value changes timeoutAct – list of actions to execute when time-span reached. Timer will be restarted when device state changed again to true. timeLoopAct – list of actions to execute when time-span reached. Timer restarted if state still true (no state changes required) initAct – list of actions to execute when scene started. By hovering mouse on actions cells, action’s details are shown In shown example for trueAct{} actions: a) time span of irrigation system calculated on line according to ambient temperature. min(max(floor(@47>value)-25,0)+10,18) b) TTS message announced (Garden Dripper has started) c) Irrigation is turned ON. The entire execution process is shown including all calculations, so user could see what exactly will happened. VacMode – vacation mode. In vacation mode by default timeSpan ignored and all Z-wave devices are converted to Activities, Scenes and VDs are not monitored. Non default vacation state could be defined in each line (vacation=”normal” or “stop”). Device index in jM{} hash table – shows device location in jM{} hash table. By hovering mouse over cells, device description, manufacturer, zwave version and JM{} line shown. At the bottom of the table list of up to 60 last executed actions (in order of execution) is displayed. (like CNN news line). If the device has same state as required by command, command isn’t executed and colored pink. Table color code: 1. Value, Criteria and Last seen columns green – state is true pink – state is false yellow – out of defined time slot, no actions or monitoring done. gray – line suspended. To suspend the line, set time-span to negative value. red - in alert-state, means this line exceeds time-span and auto-alert sent. 2. Time Slot black background and Suspended/Disabled label in gray means this line is inactive. Gray background and Activity label in green means the device assigned to control only. (Time span is zero). green background and red progress bar, device is monitored. On timeout auto-alert sent. blue background and purple progress bar, device is monitored and on timeout actions executed. (No alerts) If global variable in use, following table will be displayed Type – two types are available, Local and Global variable. Local means ‘global’ variable in use within the script (if global4local defined, those values are saved). Global is actual global variable of the system. Name – variable name Value – current variable value Modified – elapsed time since last change In case dead or nAck communication occurred following table will be displayed ID - device ID and his description is shown. nAck – number of “transfer failed” events occurred. Dead – number of “dead” reports received Is dead – current device dead status (true or false) Events history – last nACk and/or Dead events received and time-stamp of each event. Table of top active devices in your system is shown and could be used to analyze and reduce your Z-traffic. Up to 30 devices could be displayed by user configurable variable topZwave . Default is 15 ID - Since most of the devices has number of slaves, master device ID and his description is shown. By hovering on the line, slave devices and his number of events will be displayed. # – number of events occurred. % – Percentage of total events. In case reminders are active following table displayed: Rate – time interval to execute reminder RunTerms – triggers list to active reminder Note – send message as notification Reminder – reminder message By hovering mouse over “Run Terms” header, condition details displayed. Following actions are built-in : addRmd, logRmd, setRmd, delRmd, delAllRmd - reminders control disableScene, enableScene, startScene, killScene – scene control forceArm, setArmed – alarm control pressButton , setSlider, setProperty– virtual device control reboot, shutdown – system actions sendEmail, sendPush, sendiPush, sendPopup, sendNote, sendSms*, tts* – notification control setColor, setValue, turnOn, turnOff – Z-wave devices control setTimeSpan, setTimeSlot, setTimeDrift, timeSpanOn - time control setState, setStateValue, setStateDelay, setStateFormula -- parameters control vacOn, vacOff, powerOutage– special modes *not supported by the script. User defined functions. All valid actions or properties of any Zwave, Plugin or VD devices are fully supported also. By insert a new action in the tables, the action will be verified by the code and if it's valid will be in use. Special features If an error occurs during run time, it will be displayed on fixed type men. Scene will continue to run. By manual refreshing the table three times error is no longer displayed. When power outage mode activated, fixed menu displayed When vacation mode activated, fixed menu displayed As mentioned at the beginning, scene stuck without any reason and it’s true for this scene as well. To make sure that user will be notify if the scene is failed, weather triggers at the header of the script have been defined (these triggers exists by default at all systems and always work). When trigger received and the scene is failed, notification including last debug/error message sent to user. If autoRestart set to true, scene restarted automatically. Usually it takes awhile to receive weather trigger, so to speed up failure detection, recommended to add additional trigger (like motion sensor or any other device which is active often at your home) Please do not remove weather triggers… during normal operation all triggers are ignored. --[[ %% autostart %% properties %% weather Temperature Humidity Wind WeatherCondition --]] Using this script, I’m able to control over 95% percent of my needs, including irrigation system, heating system, bathrooms fans, all motion and door sensors, air conditioners and more. In my system then number of scenes reduced from 48 to 4 and virtual devices from 11 to 2. In addition my RAM consumption reduced from ~80% to 30%. The script has many options and features, so any action could be executed in several ways therefore please feel free to ask about implementation. The code is over 1,000 lines, but only ~15% of the code is actually running. Rest of the code is to display, initialize and to validate hash table data on startup. Code covers ~80 hash table syntax errors. Please read carefully displayed errors and follow instructions.- 58 comments
- 2 reviews
-
- 1
-
-
- scene
- all-in-one
- (and 1 more)
-
Version 3.1
19,432 downloads
Did some rework on Fibaro and Aeon sensors icons and few others The stand alone sensor icon actually has a little human figure stand still (white color) to use as part of inactive motion icon. Added linear icons -

Version 1.0
464 downloads
First of all the entire credit goes to @davanha who has written this text to speech (and alarm control) APK for android and continues to maintain the code. Outstanding job. Now, to my opinion, everyone should use this very simple and straight forward implementation. This is a great opportunity to give a voice to your home. I'm using TTS for years (UBI and EMIC solutions), but to have it on my phone at any place at home !!! sounds much better. Of course if you have tablet which runs Fibaro application and now you can make it speak... great feature for all your family, finally they can hear what you're doing. In my case the smart home is part of the family. I know that many users use other solutions like SONOS, Google, but not one of them has this nice and convenience way to speak directly to you or any other member of your family at any place at home. Please follow next installation steps: 1. Create TTS scene and copy the code (TTS scene v1.0-lua.txt) on your HC2. 2. Download zenitgatekeeper_0.1.651.txt to your phone or tablet. Change file extension to .apk and install the application. 3. Go to setting (initial password 1234) Application settings -> [check 'Autostart application after reboot' box] -> Http services [check all boxes on this page] see fifth screenshot-> go back till you see "Text-To-Speech mode" window (as displayed on third screenshot) 4. Usually we're cleaning our phones by killing background applications, so please lock this application on your phone. 5. To verify proper installation run on web browser follow line http://<ipadress of android device>:8080/tts=testing Your android device should now play the speech 6. You can add to play intro announcement before the message.. like "ding dong" or any other. To do so please click "Settings" button (default password to settings menu is "1234") -> Application Settings -> Http services -> Play speech on device. 7. New releases of the app are available at https://github.com/davandev/AlarmController/releases 8. Now if the setup is OK... open any code on your HC2 and execute fibaro:startScene('ttsSceneID',{"testing my text to speech setup","<IP address of android device:8080"}) fibaro:startScene('ttsSceneID',{"testing my text to speech setup","<IP address of android device>:8080",<volume level>}) Usual volume level range is 1-15. Please notice that the volume level of your phone or tablet will be changed accordingly. 9. Another great feature of zenitgatekeeper application, it can receive "wakeup" command and it will turn on the android device screen. I've found this very useful for my tablet in living room. Till now the display was constantly on, now since I have motion sensor in the room, I'm able to turn on the display only if someone in the room. It extends my tablet display life cycle. To use wakeup just start TTS scene as shown below: fibaro:startScene('ttsSceneID',{"wakeup","<IP address of android device:8080"}) For more information please visit this topic: https://forum.fibaro.com/topic/25004-using-an-android-device-as-a-text-to-speech-engine/ Notes: This solution works on your local LAN- home network only. When your device is out of range, no message will be received. But when you back to your area the device connects automatically and starts to "speak". My suggestion is to assign fixed IP address to your device on your home network. Otherwise the IP address could be changed and you'll need to change it in the code. You will hear the messages even if your phone is on mute. To stop to hear the messages you need to reduce the volume or to kill the application. Some ideas of messages could be seen on first screenshot. In addition you can install the apk application on other members of the family and you can redirect relevant messages of smart home directly to them only.