About This File
Purpose
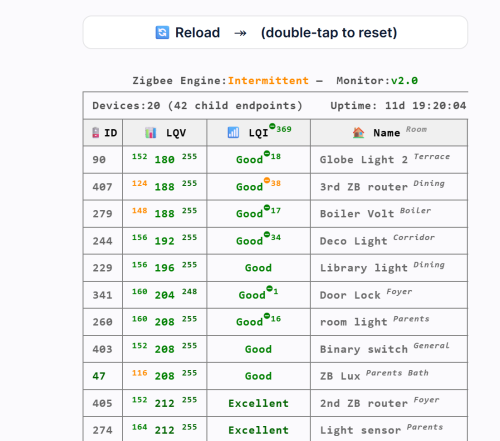
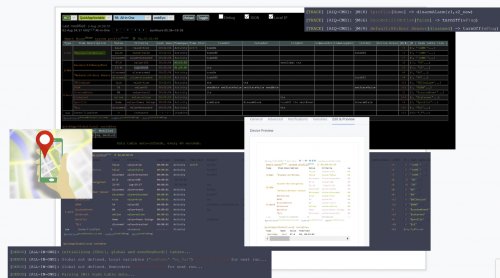
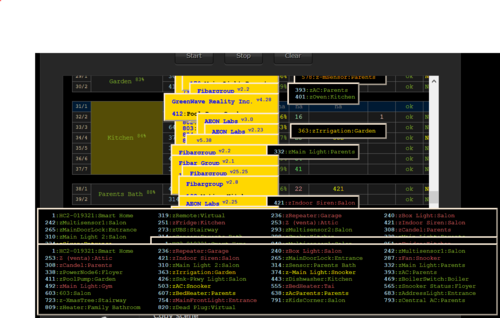
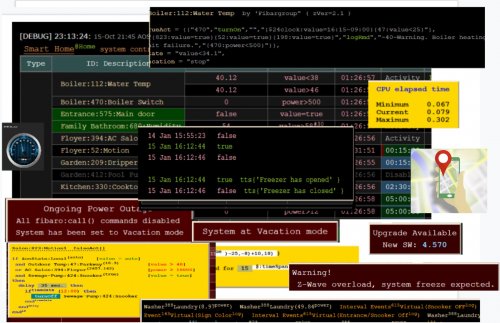
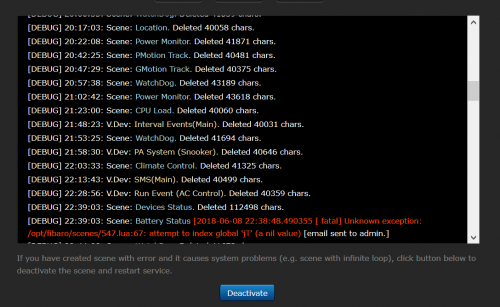
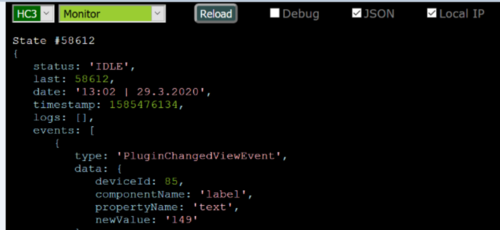
HC-WebEye is designed to enhance debugging for Fibaro smart home controllers (HC2 and HC3), especially when dealing with scenes that output HTML-formatted debug data.
Since HC3 no longer supports HTML in its debugger, this tool provides a full-screen alternative for better visibility and interaction.
5.23.1🔧 Key Features
|
Feature |
HC2 Support |
HC3 Support |
Notes |
|---|---|---|---|
|
Display scene debug info |
✅ |
✅ |
HC3 filters by tags/levels |
|
Start scene |
✅ |
✅ |
|
|
VD debug info & button press |
✅ |
❌ |
|
|
Global variable display |
✅ |
✅ |
|
|
QApp debug info |
❌ |
✅ |
Clears HC3 debugger window |
|
QApp variable display |
❌ |
✅ |
|
|
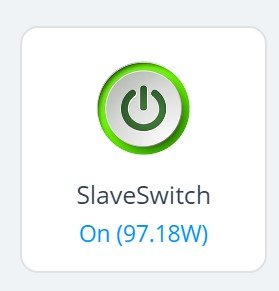
QApp toggle & button press |
❌ |
✅ |
Toggle switches ON/OFF |
5.23.2🌐 Browser Compatibility
-
Works with Firefox, Chrome, and Edge browsers
-
Requires CORS to be disabled (a separate script is provided for that)
-
Login Prompt You'll be asked to log in on first use. Credentials are not stored for security.
-
Interface Flow
-
Select controller (HC2 or HC3)
-
Choose item type (Scene, VD, Variable, QuickApp)
-
Pick specific item from list
-
Press Reload to fetch debug info
-
Optional: Check "debug" to view API commands
-
🧪 Interaction Examples
-
Scene selected → “Start” button appears
-
VD selected (HC2 only) → Button list + “Press” button
-
QuickApp selected (HC3 only) → Button list + “Press” and “Toggle” buttons
-
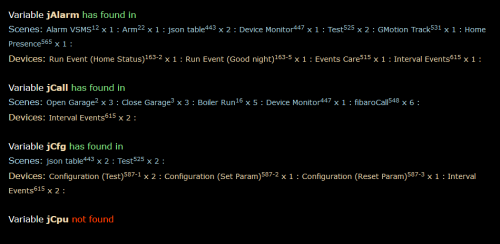
Variable selected → Current value displayed
If you're planning to use this with advanced scenes like the All-in-One Scene /QA or Z-wave monitor, this tool is practically essential for visibility and control.
Edited by cag014
What's New in Version 4.0 See changelog
Released
🆕 Update: Multi‑Hub Support & Easier Editing
✨ New Features
-
Edge Browser Option Added
Script now runs smoothly on Microsoft Edge with full compatibility. -
Multiple Hubs Support
You can now define any number of hubs in the configuration. No need to modify the logic — just add them to the list. -
Simplified Hub Editor
At the beginning of the file, a clean configuration block lets you add or remove hubs quickly.
Example:
// ============= USER CONFIGURABLE PARAMETERS =============
const controllers = [
{label: "HC2",
hubType: "HC2",
local: "http://198.0.0.69",
remote: "https://home.fibaro.com/newProxyLite?XXX&req=" },
{label: "hc3-home",
hubType: "HC3",
local: "http://198.0.1.11",
remote: "https://home.fibaro.com/newPro },
];
// ============= DO NOT CHNAGE CODE BELOW =============