
Welcome to Smart Home Forum by FIBARO
Dear Guest,
as you can notice parts of Smart Home Forum by FIBARO is not available for you. You have to register in order to view all content and post in our community. Don't worry! Registration is a simple free process that requires minimal information for you to sign up. Become a part of of Smart Home Forum by FIBARO by creating an account.
As a member you can:
- Start new topics and reply to others
- Follow topics and users to get email updates
- Get your own profile page and make new friends
- Send personal messages
- ... and learn a lot about our system!
Regards,
Smart Home Forum by FIBARO Team


Scenes
The category contains scenes submitted by users.
Downloading and submission terms have to be accepted.
Types of scenes: magic, block, LUA.
Types of files accepted: PDF, JPG, JPEG, PNG, LUA, TXT.
Scenes have to be described properly, screen shots are optional.
Support topics are created automatically here Scenes
Report topics and files that are no longer supported by authors.
All the files submitted have to be approved by administrators.
41 files
-
ReadAndSendGlobalVariables_HC3
By uwuertz
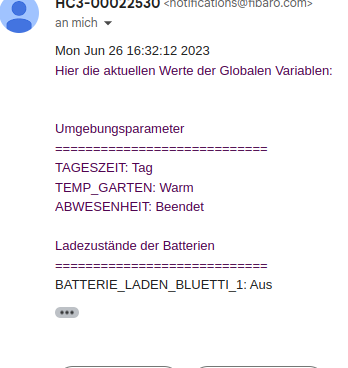
This script allows you to read out the global variables under HC3 and send them by mail.
In contrast to HC2, I did not find a way to read out all variables directly under HC3 and therefore created an array, which must be filled once with the existing variables (or when new ones are added or old ones are deleted) of YOUR HC3.
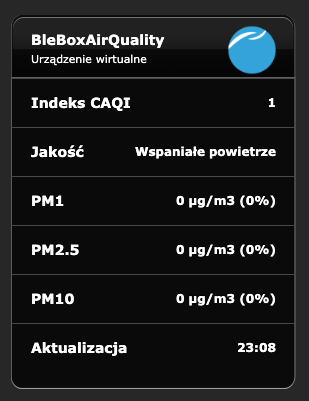
Then this works very reliably. Just create a scene with a timed trigger and paste the code on the right. Then adjust the variables and what title you want to give them. Then this is displayed easily readable in the eMail (see screenhot)
Suggestions for improvement are welcome.
51 downloads
-
 (0 reviews)
0 comments
Submitted
-
ping_shelly_vintage.lua
By Theo
v 1.1 22/05/2021 This scene polls if a Shelly Vintage bulb is online and sets its state. The default state is "opposite" which is converted to legal values "on" or "off". When state is a numeric value it is interpreted as brightness setting. Also, this scene can be called from another scene as fibaro:startScene(number_of_this_scene,{ip_number,a_state_as_described_above}); Things are complicated by the asynchronous character of the http call. With many thanks to jgab for the solution to this challenge. There is now also a VD based on this lua.
13 downloads
(0 reviews)0 comments
Updated
-
Routing Info
By jwi
Routing Information
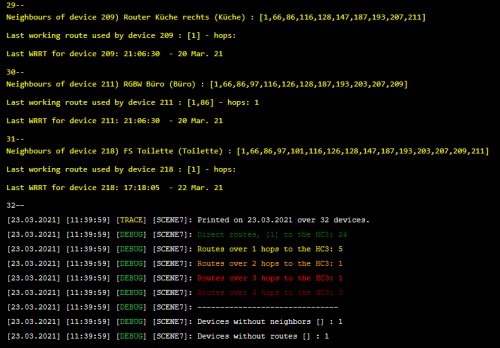
This scene reads the routing information of the ZWave devices from the API of the HC3 or HC2 .
What information is that?
the neighbors of each device the last used working route of the device the number of hops for the device the working route respose time (WRRT)
In addition, the following is checked:
whether a device has no routes or whether a device has no neighbors at all
In the summary, all devices are listed according to the number of hops.
For routes with 4 or 3 hops, the mesh network should possibly be rebuilt
for these devices.
The scene is available in 2 different versions for HC2 and HC3.
317 downloads
-
Blind Control
By Schopf16
INTRODUCTION
The script can control all blinds that are changed daily at the same time or at the same event. The script should be called cyclically every minute. For this purpose, for example, the script "Main scene FTBE" from Sankotronic can be used.
USAGE
In the blind_table add a new line for every blind and every event. The same blind may hold several events or several positions. Call the script cyclically every minute by your script which sets normally the TimeOfDay variable
PREREQUISITES
Fibaro Home Center 2
COPYRIGHT
THIS SOFTWARE IS PROVIDED 'AS-IS', WITHOUT ANY EXPRESS OR IMPLIED WARRANTY. IN NO EVENT WILL THE AUTHOR(S) BE HELD LIABLE FOR ANY DAMAGES ARISING FROM THE USE OF THIS SOFTWARE. Everyone is permitted to copy and distribute verbatim or modified copies of this license document. Permission is granted to anyone to use this software for any purpose, including commercial applications, and to alter it and redistribute it freely.
CREDITS
Scene Icon designed by Sankotronic and found at Sankotronic scene icon pack 1 1.0.0
Function calculateTime(..) copied from Sankotronic script Main scene FTBE
91 downloads
- blind
- blind open/close
- (and 1 more)
(0 reviews)0 comments
Updated
-

Smart Fade out for Sonos VD
By J3R3M
Smart fade out for Sonos
First release on french board in April 2019
INTRODUCTION
This scene allow your HC2 to smoothly shut down your Sonos speakers. You can copy this scene with differents VD IDs as much as you want.
I personnaly use it for each room in my home, and one global with all IDs.
For example, I often use the scene in my bedroom to have a sleep mode, without beeing awaken by a hard shutdown of the speakers in the room.
WHAT DOES THIS SCENE?
Look into the IDs and retrieve the volume and the room affected to the VD Look for the masters speakers (Those which can manage others speakers) Fadeout step by step every speakers Press the Pause button on masters speakers Put the volume at an audible level for next playing
WHAT'S A MASTER SPEAKER?
When you use Sonos Controller, you can create a group of speakers by adding speakers to the actual. All the speakers may play the same program simutaneously.
The speaker that you first selected is the master. It's transparent in the Sonos Controller App, but to manage Play/Pause/Programs Buttons on your HC2 server, you have to manage it on the master speaker. Actions won't be taken into account on VD of slaves speakers.
SCENE SETTINGS
-- VD List local VD = {242,243,244}; -- Duration between to steps in the fadeout local StepDuration = 3 -- Speakers Volume will be set at the following volume after the fadeout local Volume = 15 If you have modified the original VD, it's possible to update the ids for Volume Slider and Pause Button here :
-- Slider Volume ID local SliderVol = "15" -- Pause Button ID local BtnPause = "8" SCENE ICON
REQUIREMENTS
Your HC2 Server have to run on version 4.xxx Using VD Sonos Remote by Krikroff45 downloads
(0 reviews)0 comments
Updated
-
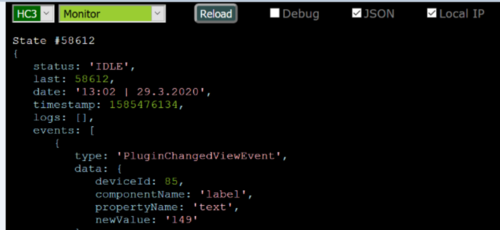
HC-WebEye
By cag014
Purpose
HC-WebEye is designed to enhance debugging for Fibaro smart home controllers (HC2 and HC3), especially when dealing with scenes that output HTML-formatted debug data.
Since HC3 no longer supports HTML in its debugger, this tool provides a full-screen alternative for better visibility and interaction.
5.23.1🔧 Key Features
Feature
HC2 Support
HC3 Support
Notes
Display scene debug info
✅
✅
HC3 filters by tags/levels
Start scene
✅
✅
VD debug info & button press
✅
❌
Global variable display
✅
✅
QApp debug info
❌
✅
Clears HC3 debugger window
QApp variable display
❌
✅
QApp toggle & button press
❌
✅
Toggle switches ON/OFF
5.23.2🌐 Browser Compatibility
Works with Firefox, Chrome, and Edge browsers
Requires CORS to be disabled (a separate script is provided for that)
Login Prompt You'll be asked to log in on first use. Credentials are not stored for security.
Interface Flow
Select controller (HC2 or HC3)
Choose item type (Scene, VD, Variable, QuickApp)
Pick specific item from list
Press Reload to fetch debug info
Optional: Check "debug" to view API commands
🧪 Interaction Examples
Scene selected → “Start” button appears
VD selected (HC2 only) → Button list + “Press” button
QuickApp selected (HC3 only) → Button list + “Press” and “Toggle” buttons
Variable selected → Current value displayed
If you're planning to use this with advanced scenes like the All-in-One Scene /QA or Z-wave monitor, this tool is practically essential for visibility and control.
753 downloads
-
Energylogger for integration to Raspberry Pi
By perjar
This is a scene for Fibaro HC2 which sends energy consumption data for selected devices to a logger function at the end of each day. The logger runs on a Raspberry PI on the same network and simply saves the data in a .CSV file on the Pi for later import into a spreadsheet. Remember to chose UTF-8 format in Excel when you import it, or special and national characters will be lost.
The code running on Raspberry Pi is run as a service under systemd, hence the .service unit file.
You should drop the .txt file extension when copied to the Pi.
Tutorial about running services under systemd: https://tecadmin.net/setup-autorun-python-script-using-systemd/
89 downloads
(0 reviews)0 comments
Updated
-

TRV Boost
By Dave_H
Purpose: Fully open the radiator valves in order to heat up the rooms more quickly.
Notes:
One of the problems that I have with my Danfoss radiator valves is that they do not seem to fully open when required. For example, I have a radiator in a very cold room, which, let's say the room temperature is 10°C and I've set the TRV to 15°C, then the valve barely opens and as a result, the room doesn't reach the target temperature. It's almost as though the TRV isn't taking into account the current room temperature when determining how far to open the valve. There only seems to be a direct correlation between the target temperature and the valve opening. So for example, when the target temperature is 15°C then the valve is only open slightly, at 21°C then it's open half-way, and at 28°C it's fully open.
I want my rooms to heat up as quickly as possible when they need heat so I created this scene to monitor the room temperatures and control the valve opening as appropriate in order to fully open the valves when needed. When the room temperature is below a certain threshold lower than the heating panel zone temperature, then the valve target temperatures are boosted to 28°C in order to fully open them. Once the room temperatures are close to reaching the required zone temperature, then the valve temperatures are returned to normal.
Setup required:
Boost Temperature Set this to the temperature which causes the valves to fully open.
local boostTemp = 28
Boost Duration The maximum number of minutes that the valve target temperature will be boosted for. This should not need changing. Once the room has reached the desired temperature then the boost will be turned off. If the room has not reach the desired temperature within this duration, then the boost will be turned on again.
local boostDuration = 120
Turn on Threshold The temperature below the target room temperature defined in the Heating Panel Zone which will cause the TRV to go into boost mode.
local turnOnTrigger = 0.7
Turn off Threshold The temperature below the target room temperature which will cause the TRV to return to normal mode. We want to try to prevent overshoot as much as possible, so the boost mode is turned off before the desired room temperature has been reached. If your rooms heat up quickly, then you might want to increase this value.
local turnOffTrigger = 0.3
Valve device types The list of device types that are used to identify the TRV valves.
local valveTypes = {"com.fibaro.thermostatDanfoss", "com.fibaro.setPoint", "com.fibaro.FGT001"}
The device types can be found via the Fibaro API, eg: http://<Fibaro IP Address>/api/devices/123 where 123 is the device ID, or via the API documentation portal at http://<Fibaro IP Address>/docs/#!/devices/getDevice. The device type can be found in the response message:
{ "id": 123, "name": "Radiator Valve 1", "roomID": 4, "type": "com.fibaro.thermostatDanfoss", "baseType": "com.fibaro.hvac", "enabled": true, "visible": true, "isPlugin": false, "parentId": 129, "remoteGatewayId": 0, "interfaces": [ If you are not able to use the device types in order to identify your valves, then you can define a list:
local valveIDs = {123,234,345,876} And then remove the following code which builds the list of device IDs:
-- Get the list of TRV Ids using the list of types -- If non-TRV devices are returned then more filtering may be required -- or a hardcoded list of ids can be used. local valveIDs = {} for i, valveType in pairs(valveTypes) do local valveIDs1 = fibaro:getDevicesId({type = valveType, enabled=true, visible=true}) --print(valveType .. " " .. json.encode(valveIDs1)) valveIDs = array_concat({valveIDs, valveIDs1}) end
This scene needs to be triggered to run every few minutes using a timer scene. If you do not have one, then take a look at this scene or search for one in the downloads area of the forum:
75 downloads
(0 reviews)0 comments
Submitted
-
 (0 reviews)
0 comments
Submitted
-

Sceny do Urządzeń
By wodzislawski
Kilka scen dedykowanych do określonych grup urządzeń.
137 downloads
(0 reviews)0 comments
Submitted
-

idlock_Notification.lua
By jompa68
Get a notification/push when IDLock is unlocked by code or RFID
Other possibilites
Instead of having default value for name (example ->> "name":"User 60") you can
easily change from User 60 to a real name instead.
In a new scene add this lines and Press Start to set the name
local ID = 1067 -- IDLock ID
fibaro:call(ID, "setUserName",60, "Jonny")
60 is the slotID you want to change.
61 downloads
- idlock150
- notification
- (and 1 more)
(0 reviews)0 comments
Submitted
-
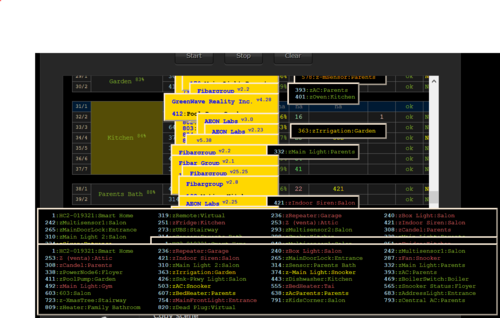
Z-Range analyzer
By cag014
First of all, I would like to express my sincere appreciation to @10der @Alex @petergebruers @robmac @amilanov @Bodyart @drboss and others for their time and help to improve / debug the code.
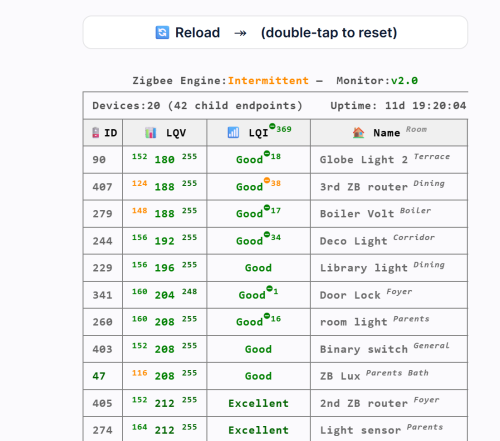
The scene “analyzes” mesh network configuration in the system and displays the location efficiency of the devices in table format. Table sorted by the rooms according to average location efficiency of the devices in the room (in ascending order - from lowest to highest efficiency). More like "Z-wave mapping" in your residence.
In addition scene analyzes location efficiency of HC2 location.
To achieve precise data, please make sure your devices' physical location correctly associated with room names.
For example:
in-wall switch located in kitchen, but controls lights in garden, should be assigned to kitchen and not garden. (the device name should be assigned as garden lights)
Usually inclusion of the device done close to HC2 therefore the route table is incorrect. To achieve reliable data, perform inclusion when device located in designated place/spot in residence or perform Mesh Reconfiguration to device after inclusion near to HC2.
User configurable parameters,:
showDevices=false if set tot true,not sorted table of all devices will be displayed also). fontSize=100 font size percentage (80% - 150%). Big Note:
If you've removed device which is part of mesh route to others, the route table doesn't get updated !
Controller continues to maintain undated route table! Mesh table must be reconfigured. (Z-Range Analyzer identifies these devices.)
Warning: Battery powered devices cannot forward packets and cannot be used in route for others.
To observe data in graphic, use @10der's visualizer.
Run the scene and here some details on what will be displayed:
When or if corrupted/deleted devices have found in your system, data details will be printed before table appearance.
Table header:
· Number of master (physical) and slave devices in the system. By hovering mouse over controller name, table color index and Z-Capacity are shown
· Date range of displayed data (if any changes done like adding, relocating devices after this date, mesh reconfiguration requires)
· HC and devices location efficiency. If devices lack mesh route data (colored by red) present in the system, two efficiency numbers displayed. (50%/60%).
including devices with no routes and neighbors data excluding these devices. Table columns:
1. #
Script's total serial number / Script's serial number in room
2. Room Name %
Room name and average location efficiency of the devices in room
3. Parent ID: Name
Parent (master) device ID, name and room. Devices lack mesh route data colored by red. By hovering mouse over, child (slave) devices list is shown (and number of last 24 hours z-wave events of each slave)
4. %
Percentage of location efficiency of each device in the room.
5. iSee
Total number of neighbors (adjacent) devices that it can communicate with (seen by device). By hovering mouse over, devices details are shown. Great view on how device located by seeing who neighbors are.
The data shown in two colors:
I. green - Device can communicate directly to controller. Shades of green according to number of adjacent neighbors. greener, more neighbors)
II. red - Device doesn’t communicate directly to controller. Shades of red according to number of adjacent neighbors. (redder, less neighbors)
If tilde sign appears before the number - means the list includes device(s) that not in the system (deleted device). I devices details menu this device marked grey.
4. Last Route
List of devices that participate in route communication to controller. By hovering mouse over list of devices details is shown.
3. iRoute
Total number of devices where this device is part of communication route. By hovering mouse over, devices details are shown.
5. Status
Last working route status. (OK, pending, in progress, error)
6. Time Stamp
Time stamp of last working route reported to the controller.
7. 24History
Master's last 24 hours events number and percentage of total events. By hovering mouse over parent in Parent ID: Description column, number of z-wave events for each slave is shown. Please notice 24 hours history based on saved logs in event panel. If you have devices that excluded from saving logs, theirs events are not available.
Points for improvement
Location efficiency calculated relatively to your best device in system, therefore red and yellow marked devices don't necessary indicates that your system is broken.
Special attention requires when changing/removing physical place of devices in location with low efficiency level, it could cause loss of communication or delays.
I. Parent ID: Description - Device marked red indicates lack of route data. Perform mesh reconfiguration for this device. If reconfiguration failed, recommended to exclude/include the device (Painful process and occasionally updates in code are required).
II. Last Route - More devices in route increase probability of communication delay and indicates that device is in distance from controller. Since in Z-Wave each device calculates the shortest route to the destination (up to 4 hops), therefore if route includes more than three devices recommended
Check/verify devices in route as well. Mesh reconfiguration recommended. Device is far away from HC2 or Z-wave signal interrupted. III. iSee - If number is in shade of red and relatively low, means the device located far away from controller and low number of adjacent neighbors in that area or device located where physical barriers such as metal panels, concrete walls and etc. are blocking Z-Wave signal. (or located in-wall socket and Z-wave signal interrupted) Increased probability of packets loss rate, delay expected.
IV. iRoute - As much as number is higher, means increased workload for this device (needs to track messages from this number of neighbors). Increased probability of delays from device and routed devices. Recommended number less than five devices.
V. Route tables do not get automatically updated by adding a new device or device relocation. Mesh reconfiguration (in Z-Wave Panel) requires.
Do not reconfigure mesh network when devices are not in designated spot.
927 downloads
-
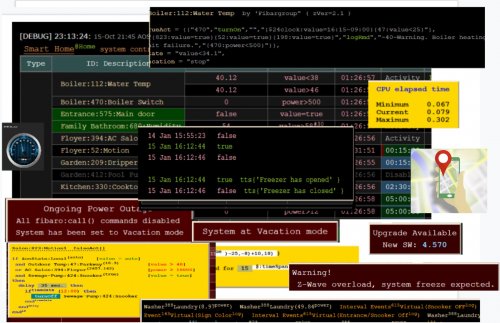
All-in-One Scene
By cag014
This script is designated to control and monitor your home system. Script automatically identifies the type of elements in the system. (Z-wave device, virtual device, scene, automatic scene (Block, Magic or Lua). Any valid Z-wave device property and his value could be monitored, controlled and execute commands accordingly.
If you don’t want or need to use this script, but have issues with your system (like delays, z-wave devices don’t respond always, scene receives no triggers), it helpful to run this scene as is (without any changes) just to monitor and to identify z-wave “dead” and/or NACK occurrences in your system. You’ll receive on-line notifications about it.
The first time you use All-in-One Scene, you will need to define jM {} hash table. Each line in table has two mandatory and two optional fields.
jM={ { 15, "137|630",{timeSlot={“12:00~18:00”},state="value=true", trueAct={“|230|”, “turnOn”,””}}} }
time span IDs list Criteria & Rules Action tables
a) time span a period of time (in minutes) within which some activity must be performed by device or scene. Additional two option could be defined:
I. time span = 0 defines the line as activity only.
II. time span = ‘negative number’ line is suspended (remarked)
b) IDs list given list of devices/scenes/VD/global/keywords. Use under score for scene IDs. (“_45”).
a) global variable – add an ampersand sign & to global variable name: &varName
b) keyword – add a dollar sign $ to keyword variable: $name
Note: To use & and $ characters for other purpose , add % after the character.
c) Criteria & Rules (optional) property, state, time slot, vacation mode…
d) Action tables (optional) tables of commands to be executed.
By defining String-to-number table which converts device name to ID jS2n= {boiler=137, dryer=630}
jM{} above table will look like, device name must be included within back apostrophe sign.
jM={ { 15, "`boiler`|`dryer`",{timeSlot={“12:00~18:00”},state="value=true", trueAct={“|230|”, “turnOn”,””}}} }
1. Monitor option
There are so many times that scenes or Virtual devices are stuck w/o any understandable reason. Some devices suddenly stop to send reports or don’t change state. In most of the cases we don’t aware about the problem till something goes very wrong. The monitor option will send an alert in case of defined states are timed out.
Note: In order to monitor virtual devices, fibaro:log() command must be included in main loop or in button’s code. For example, just add fibaro:log(“done”) at end of your main loop and VD could be monitored.
Example to set watchdog timer for devices, scenes, virtual devices, global variables and keywords
jM={ {8, "_17|_545",{timeSlot=”10:00~22:00”}}, -- within every 8 min. between 10am to 10pm, scenes 17, 545 must be active. If not alert sent.
{3,"134|618|_556|_588"}, -- within every 3 min. devices 134,618 and scenes 556,588 must be active. If not auto-alert sent.
{10,”132|145”,{property=”power”}}, -- within every 10 min. devices in list must report new power value. If not auto-alert sent.
{5,”112”,{state=”value=true”}}, -- if device’s value is true over 5 minutes, auto-alert sent. (e.g. device stuck in breached state)
{30,”470”,{state=”power>10”}}, -- if device’s power greater than 10 over 30 minutes, auto-alert sent.
{20,”&HomeStatus|$iDoor”}} -- if global variable HomeStatus or keyword iDoor didn’t change within 20 min., auto-alert sent.
2. Control option
This part of the script enables execution of actions based on device state or value changes. Script supports many options, calculations, time modifications, if statement and other features to do almost everything that you need to control your home just with one scene (which even doesn’t trigger by the system).
Six action tables could be defined: (See AOS Advanced User’s Guide for more information.)
trueAct{} - executed when state status is true. Please do not confused between state and value. If state defined as “value=false”, state status is true when value of device is false.
falseAct{} - executed when state status is false. Please do not confused between state and value. If state defined as “value=false”, state status is false when value of device is true.
trigAct{} - executed on every value change at any mode, true or false
timeoutAct{} - Disables auto-alert notification and executed when elapsed time exceeds time span. Time span counting restarted after state status back to true.
timeLoopAct{} - Disables auto-alert notification and executed when elapsed time exceeds time span. Time counting restarted immediately even if status remains true (no back to true change required).
InitAct{} - Set of specific actions to be executed on startup only.
Here is an example of most common wanted scenario, to turn on light when motion sensor breached and turn off light when sensor back to safe after few minutes (3 min. in this example)
jM={0,”`mSensor`”,{state=”value=true”,trueAct={“`lightSw`”,”turnOn”,””},falseAct={“`lightSw`”,”turnOff”,”180”}}}
Since no need to turn on light during the day, timeslot could be defined
jM={0,”`mSensor`”,{state=”value=true”,timeslot=”18:00~07:00”,trueAct={“`lightSw`”,”turnOn”,””},falseAct={“`lightSw`”,”turnOff”,”180”}}}
But now could be an issue to turn off the light, if sensor breached few seconds before end of timeslot and back to safe out of time slot, falseAct{} table won’t be executed. In this case, turning light off should be part of trueAct{} table
jM={0,"`mSensor`”,{state=”value=true”,timeslot=”18:00~07:00”,trueAct={{“`lightSw`”,”turnOn”,””},{“`lightSw`”,”turnOff”,”180”}}}
Same Z-wave device, global variable and keyword could be defined at several lines (no limit). Scene and Virtual devices could be defined one time only.
Please download
1. AOS Advanced User’s Guide - complete instructions and information
2. AOS Quick Guide – syntax format reference and examples
3. AOS HC-WebEye Viewer Guide - AOS browser viewer guide
4. timeDrift – If you considering to use time drift correction, please download this scene and follow instructions at header.
Script Advantages:
No Lua or any software knowledge required. Supports time drift correction. (download timeDrift scene) Supports vacation and power outage modes. Provides excellent view of all devices, global and keyword variables at a glance, including: status, current value, up to 20 last values & executed commands. (Defined by dataRecord variable) Each command to be executed with current variable values is shown All items displayed by their names, including VD buttons in human readable format (not just IDs) At the bottom of the table up to 50 last commands in execution order are displayed (defined by cnnLine variable) Commands executed much faster than using system’s standard triggering mechanism (Lua, Block or Magic) No limits of scene’s “Max. running instances” Complex operation could be executed by newbie users (like experts). Anti-ripple delay could be applied. (change status after specific delay according to latest value) Actions could be executed by/from Scenes and VDs. Add/Change/Suspend any action in few seconds of work. Z-Wave traffic always monitored and summary of the traffic displayed. Dead and NACK occurrences of entire system immediately reported, recorded and notification sent to user. Repeated commands and device’s reports (RPT) of entire system are recorded and displayed. Global variables names, elapsed time from last change and their current values are shown. (Variables used in table) Details of all actions and commands are displayed in popup menus. Keeps Z-wave traffic low as possible by verifying device state before sending command. If device ID changed (excluded/included), user needs to update device ID in one place only! No extra jSON tables. Keeps your RAM load low All data displayed as a table where all configured devices and their related data displayed in human readable format. Extra button 'Refresh' will appear and covers 'Clear' button. Press ‘Refresh’ or ‘Start’ buttons to refresh table data.
Table's header includes:
startup time stamp, script current version, scene Name, LED as displayed at HC2 front panel, sunrise/set hours.
System name – by hovering mouse over, system inventory shown
Current home mode (@home or @vacation)
system status - by hovering mouse over, last system's activities is shown
Elapsed time
Total Z-wave events - by hovering mouse over summary of all activities shown
Min, average and max Z-traffic, by hovering mouse over CPU elapsed time shown
By hovering mouse over column headers, quick guide is shown. Quick guide displayed during 5 minutes from startup. On every manual refresh, the guide displayed for next 5 minutes.
Table columns are:
Type – device type (Z.Device, G. Variable, V.Device, luaScene, blockScene, magicScene, Auto-luaScene, Auto-blockScene, Auto-magicScene). By hovering mouse over Z.dev type column, top active devices are shown. User configurable by setting topActive global variable. (0-30) default 15
ID: Description – room name: device ID: device name. Z-wave devices sorted by rooms, then by device ID.
Battery capable device have green background according to current battery level. If device armed, alarm icon appears.By hovering mouse over, inventory of devices in jM{} table are shown.
Value – items current value. By hovering mouse over, latest values, trigger value and command executed are shown.
Criteria – state of evaluation to determine true or false status. If formula included, the state displayed in Italic fonts and by hovering mouse over, popup menu shows the formula and calculations
Last seen – elapsed time since last status change.
Alert – by default this column isn’t shown. If any devices have been alerted the column will be shown. Please notice that in some cases the device could be alerted, but after while it could back to normal activity. For example, if motion sensor is breached over specified time-span, alert notification will be sent. But after a while the sensor back to safe and alert is canceled, “back to normal” notification will be sent. At header of alert column shown current number of alerts
Time Span – time span to monitor state of items. By hovering mouse over, maximum reached span time shown.
If time span set to 0, then this line acts as activity, no timeout alerts reported.
If time span set to negative number, this line is suspended and no actions executed.
Time Slot – Active time slot range to execute related actions. Timestamp to execute specific action at specific time.
trueAct – list of actions to execute when state is true.
falseAct – list of actions to execute when state is true.
trigAct – list of actions when value changes
timeoutAct – list of actions to execute when time-span reached. Timer will be restarted when device state changed again to true.
timeLoopAct – list of actions to execute when time-span reached. Timer restarted if state still true (no state changes required)
initAct – list of actions to execute when scene started.
By hovering mouse on actions cells, action’s details are shown
In shown example for trueAct{} actions:
a) time span of irrigation system calculated on line according to ambient temperature. min(max(floor(@47>value)-25,0)+10,18)
b) TTS message announced (Garden Dripper has started)
c) Irrigation is turned ON.
The entire execution process is shown including all calculations, so user could see what exactly will happened.
VacMode – vacation mode. In vacation mode by default timeSpan ignored and all Z-wave devices are converted to Activities, Scenes and VDs are not monitored. Non default vacation state could be defined in each line (vacation=”normal” or “stop”).
Device index in jM{} hash table – shows device location in jM{} hash table. By hovering mouse over cells, device description, manufacturer, zwave version and JM{} line shown.
At the bottom of the table list of up to 60 last executed actions (in order of execution) is displayed. (like CNN news line). If the device has same state as required by command, command isn’t executed and colored pink.
Table color code:
1. Value, Criteria and Last seen columns
green – state is true
pink – state is false
yellow – out of defined time slot, no actions or monitoring done.
gray – line suspended. To suspend the line, set time-span to negative value.
red - in alert-state, means this line exceeds time-span and auto-alert sent.
2. Time Slot
black background and Suspended/Disabled label in gray means this line is inactive.
Gray background and Activity label in green means the device assigned to control only. (Time span is zero).
green background and red progress bar, device is monitored. On timeout auto-alert sent.
blue background and purple progress bar, device is monitored and on timeout actions executed. (No alerts)
If global variable in use, following table will be displayed
Type – two types are available, Local and Global variable. Local means ‘global’ variable in use within the script (if global4local defined, those values are saved). Global is actual global variable of the system.
Name – variable name
Value – current variable value
Modified – elapsed time since last change
In case dead or nAck communication occurred following table will be displayed
ID - device ID and his description is shown.
nAck – number of “transfer failed” events occurred.
Dead – number of “dead” reports received
Is dead – current device dead status (true or false)
Events history – last nACk and/or Dead events received and time-stamp of each event.
Table of top active devices in your system is shown and could be used to analyze and reduce your Z-traffic. Up to 30 devices could be displayed by user configurable variable topZwave . Default is 15
ID - Since most of the devices has number of slaves, master device ID and his description is shown. By hovering on the line, slave devices and his number of events will be displayed.
# – number of events occurred.
% – Percentage of total events.
In case reminders are active following table displayed:
Rate – time interval to execute reminder
RunTerms – triggers list to active reminder
Note – send message as notification
Reminder – reminder message
By hovering mouse over “Run Terms” header, condition details displayed.
Following actions are built-in :
addRmd, logRmd, setRmd, delRmd, delAllRmd - reminders control
disableScene, enableScene, startScene, killScene – scene control
forceArm, setArmed – alarm control
pressButton , setSlider, setProperty– virtual device control
reboot, shutdown – system actions
sendEmail, sendPush, sendiPush, sendPopup, sendNote, sendSms*, tts* – notification control
setColor, setValue, turnOn, turnOff – Z-wave devices control
setTimeSpan, setTimeSlot, setTimeDrift, timeSpanOn - time control
setState, setStateValue, setStateDelay, setStateFormula -- parameters control
vacOn, vacOff, powerOutage– special modes
*not supported by the script. User defined functions.
All valid actions or properties of any Zwave, Plugin or VD devices are fully supported also.
By insert a new action in the tables, the action will be verified by the code and if it's valid will be in use.
Special features
If an error occurs during run time, it will be displayed on fixed type men. Scene will continue to run. By manual refreshing the table three times error is no longer displayed.
When power outage mode activated, fixed menu displayed
When vacation mode activated, fixed menu displayed
As mentioned at the beginning, scene stuck without any reason and it’s true for this scene as well.
To make sure that user will be notify if the scene is failed, weather triggers at the header of the script have been defined (these triggers exists by default at all systems and always work). When trigger received and the scene is failed, notification including last debug/error message sent to user. If autoRestart set to true, scene restarted automatically. Usually it takes awhile to receive weather trigger, so to speed up failure detection, recommended to add additional trigger (like motion sensor or any other device which is active often at your home)
Please do not remove weather triggers… during normal operation all triggers are ignored.
--[[
%% autostart
%% properties
%% weather
Temperature
Humidity
Wind
WeatherCondition
--]]
Using this script, I’m able to control over 95% percent of my needs, including irrigation system, heating system, bathrooms fans, all motion and door sensors, air conditioners and more. In my system then number of scenes reduced from 48 to 4 and virtual devices from 11 to 2. In addition my RAM consumption reduced from ~80% to 30%.
The script has many options and features, so any action could be executed in several ways therefore please feel free to ask about implementation.
The code is over 1,000 lines, but only ~15% of the code is actually running. Rest of the code is to display, initialize and to validate hash table data on startup. Code covers ~80 hash table syntax errors. Please read carefully displayed errors and follow instructions.
4,185 downloads
- cag014
- all-in-one
- (and 1 more)
-
Scene timer
By jgab
This is a scene that runs in the background and schedules your scenes that have a '%% timer' included
(the original thread for this scene is <here>)
Scenes can trigger on devices changing status (%% properties), when globals change values (%% globals) and events (%% events) etc.
However, there is no trigger for time or timers - to allow a scene to be started at a specified time.
Well, here is a fix for that... and it makes it very easy to start scenes at specified times of day including sunrise/sunset, at regular intervals, at specified weekdays, and at specified months...
The scene below watches other scenes and allows them to declare "%% time" headers that they will be triggered on
When the Timer.lua scene is installed and started (no configuration needed) we should be able to forget about it and turn our attention to scenes that we want to be triggered at given times.
It's a perfect "tool" to have running on the HC2 as it makes it really easy to add a scene and schedule it to run at a given time. A simple added header to the scene is all that is needed:
--[[ %% properties %% events %% globals %% time 15:00 --]] print("Scene started at 15:00") This scene will be run at 15:00 every day. To stop it from being scheduled, just remove the "%% time" lines from the header and save the scene again.
A more extensive example with a scene declaring multiple triggers and retrieving the trigger when the scene gets invoked;
--[[ %% properties %% events %% globals %% time log 15:00 bar -- scene triggered at 15:00 every day *00:15 test -- scene triggered every 15min throughout the day --]] print("Scene started") -- Redefine fibaro:getSourceTrigger do local a,b=fibaro;b=a.getSourceTrigger;function a:getSourceTrigger()local c=b(a)local d=a:args()if type(d)=='table'and d[1]and type(d[1])=='table'then if d[1].type~= nil then return d[1]end end;return c end end local st=fibaro:getSourceTrigger() if st.type=='time' and st.time then -- do something when we get a time trigger... fibaro:debug(string.format("Triggered:%s, tag:'%s'",st.time,st.tag)) end if st.type=='time' and st.tag=='log' then -- write out log messages from the time scene fibaro:debug("Time log:") fibaro:debug(st.log) end if st.type=='time' and st.tag=='error' then -- write out error messages from the time scene fibaro:debug("Time error:"..st.log) end In the scene we also redefine fibaro:getSourceTrigger() to return our timer as an "standard" source trigger. It's not strictly necessary as time triggers are of type 'other' with the arguments coming from fibaro:args(). However, this makes it more streamlined and plays well with standard fibaro source triggers. The timer scene is "drift free" so if you declare a timer on the hour you will be called exactly on the hour, and not slowly start to drift as is very common in many home made Lua timer loops.
Standard 'time' triggers look like
{type='time', tag=<tag>, time=<str>} tag=<tag> is the (optional) word provided last in the time rule and helps us to identify what time rule triggered our scene.
time=<str> is the time the rule is invoked (in HH:MM format)
Here we also add the keyword 'log' under "%% time" to instruct the time scene to send us log statements.
Log statements come in two versions
{type='time', tag='log', log=<msg>} Standard log messages are sent at startup and at midnight with the log msg containing information about the time rules scheduled. It's usually nice to get some feedback that the Timer scene has scheduled our scene and for what times.
{type='time', tag='error', log=<msg>} Error messages are always sent (even without the 'log' keyword). Usually due to time rules being faulty.
When you enable log messages your scene will also be triggered by log messages and not only timers. You need to tell them apart. A good way to test for a time trigger that is not a log message is to test if there is a .time field in the source trigger
if sourceTrigger.type=='time' and sourceTrigger.time then --- do whatever end IN that case we know that it is a proper time trigger and not a log message, as they lack the .time field.
Ok, the time rules in the example are
15:00 bar This means that the scene is called 15:00 every day, with the identifier tag "bar"
In the scene we get an sourceTrigger at 15:00 of type
{type='time', time='15:00', tag='bar'} In the above example we just print out the tag.
*00:15 test creates a repeating timer that triggers the scene every 15 minutes, and with the tag "test". We get a sourceTrigger of type
{type='time', time='*00:15', tag='test'}
The generic version of a time description looks like
%% time <time list> <conditions> <tag> : <time list> <conditions> <tag> Examples
15:00,17:00 test
creates two timers at 15 and 17 with the same tag "test". sunrise test
'sunrise' is a valid time descriptor and evaluates to todays sunrise hour. 'sunset', "dawn", and "dusk" are available too. sunrise-00:10 test
We can do simple arithmetic on times (+/-) to create offsets. 15:00 wednesday test
timers at 15 but only on wednesday, tag "test". 15:00 wed test
days can be shortened 15:00 wed,fri test
or listed. 15:00 wed..fri test
or intervals. 15:00 1..7 test
interval with first to seventh day of the month 15:00 lastday test
Only on the last day of the month 15:00 lastweek test
only in the last week of the month (number_of_days_in_month-6..number_of_days_in_month) 15:00 monday lastweek test
conditions can be combined. True for Monday of the last week 15:00 monday lastweek may..aug test
month conditions also available. *00:15 test
interval, every 15min starting immediately (when the script starts). Ex. 12:08:33, 12:23:33, 12:38:33 ... +00:15 test
interval, every 15min, starting on next even 15min interval. Ex. 12:15:00, 12:30:00, 12:45:00 ... +00:15 weekends 10:00..15:00 test
combined with weekend test (sat..sun) and time interval (10:00 to 15:00) +01:00 sunrise..sunset may..sep water
every hour between sunrise and sunset and between May and September call scene with tag 'water' 20:30 2020/05/28,2021/05/27,2022/05/26 earth_hour
"long date" format +01:00 oct/28/10:00..dec/30/07:00 tag
Long date intervals. Year can be excluded and month can be the name of the month, and time can optionally be added at the end (not sunrise/sunset)
The <time list> should be seen as the times we want to schedule and the <conditions> as filters, excluding some times from the <time list>
The other way to look at the list of <conditions> is that the spaces are ANDs and commas are ORs. Ex."10:00 thu,sat lasweek tag" is "10:00 ((thu OR sat) AND lastweek), tag"
The complete set of conditions are:
<time>..<time>, time interval in HH:MM or HH:MM:SS (but also 'sunset' and 'sunrise') <week day>..<week day>, day interval. mon..wed, Thursday..Saturday <day number>..<day number> - 1..7, first to second day in current month <month>..<month>, month interval <time>,<time> -- One or more time specifiers. Ex. 10:00,11:00 <week day>,<week day> -- One or more day specifiers. Ex. monday <day number>,<day number> -- Ex. 1,8,15,22 <month>,<month> -- One or more month specifiers. Ex. june,july,august <long date>..<long date> - YYYY/MM/DD/HH:MM. Year cane be left out and time part is optional <long date>,<long date> - 2020/may/11/10:00, may/11/10:00, may/11 alldays - same as mon..sun weekends - same as sat..sun weekdays - same as mon..sun lastday - true if last day of the month lastweek - true if last week in the month true - always return true. See example below using fibaro global to disable rules false - always return false. Effectively disabling the rule. ...and they can be combined.
It's allowed to end a time rule with a comment '--'. It's just removed before parsing the rule. (Wouldn't it be nice to be able to add comments to all headers?)
Ex.
15:00 monday test -- Trigger scene every Monday at 3 PM
A simple example turning on a lamp (with deviceID 55) at sunset-10min and turning off the lamp at sunrise+10min on weekdays
--[[ %% time log sunset-00:10 weekdays turnOn sunrise+00:10 weekdays turnOff --]] print("Scene started") -- Redefine fibaro:getSourceTrigger do local a,b=fibaro;b=a.getSourceTrigger;function a:getSourceTrigger()local c=b(a)local d=a:args()if type(d)=='table'and d[1]and type(d[1])=='table'then if d[1].type~=nil then return d[1]end end;return c end end local st=fibaro:getSourceTrigger() if st.type=='time' and st.tag='turnOn' then fibaro:call(55,"turnOn") end if st.type=='time' and st.tag='turnOff' then fibaro:call(55,"turnOff") end --[[ -- Another solution if st.type=='time' and st.time then fibaro:call(55,st.tag) end --]]
The tag is useful to identify what timer you get so you don't have to test against time again (or you can use it as in the example above, as an argument to a function, fibaro:call in the above case).
We can also let the tag be the name of a function called in our scene at that time. .
--[[ %% properties %% events %% globals %% time log 15:00 bar *00:15 test %% autostart --]] print("Scene started") -- Redefine fibaro:getSourceTrigger do local a,b=fibaro;b=a.getSourceTrigger;function a:getSourceTrigger()local c=b(a)local d=a:args()if type(d)=='table'and d[1]and type(d[1])=='table'then if d[1].type~=nil then return d[1]end end;return c end end local st=fibaro:getSourceTrigger() function bar() print("Bar called") end function test() print("Test called") end if st.type=='time' and st.time then fibaro:debug(string.format("Triggered:%s, tag:'%s'",st.time,st.tag)) if _ENV[st.tag] then _ENV[st.tag]() end end
A more advanced feature is that time rules allows for substituting in values from fibaro globals.
Ex.
<myTime> monday test This will fetch the value from the the fibaro global "myTime" and insert whatever value it has instead of <myTest>. If the value was "10:00" the rule would be
10:00 monday test The substitution can be anywhere in the rule and contain anything so be careful.
We also watch if the value of "myTime" changes and if it does it will update the timers for the scene.
One way to use this is to have a global, ex "Stop" that is set to "true" or "false". If we include that in a rule
10:00 monday <Stop> test We can easily enable/disable the rule depending on what we set "Stop" to.
251 downloads
- scheduler
- scheduling scenes
- (and 1 more)
(5 reviews)0 comments
Updated
-
-
OWM_API.lua
By jompa68
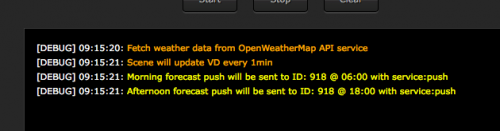
-- Fetch data from OpenWeatherMap API
-- Requires registration, free account. https://home.openweathermap.org/users/sign_up
-- List of city ID city.list.json.gz can be downloaded from http://bulk.openweathermap.org/sample/
-- 2019-03-20 - Beta version
You can use lang parameter to get the output in your language. OWM support the following languages that you can use with the corresponded lang values:
Arabic - ar, Bulgarian - bg, Catalan - ca, Czech - cz, German - de, Greek - el, English - en, Persian (Farsi) - fa, Finnish - fi, French - fr, Galician - gl, Croatian - hr, Hungarian - hu, Italian - it, Japanese - ja, Korean - kr, Latvian - la, Lithuanian - lt, Macedonian - mk, Dutch - nl, Polish - pl, Portuguese - pt, Romanian - ro, Russian - ru, Swedish - se, Slovak - sk, Slovenian - sl, Spanish - es, Turkish - tr, Ukrainian - ua, Vietnamese - vi, Chinese Simplified - zh_cn, Chinese Traditional - zh_tw.
Scene updates VD
175 downloads
(0 reviews)0 comments
Submitted
-
Print json string in readable format
By perjar
This function can come in handy if you want to print a json structure in readable form for debugging or inspection.
It takes a json string as input and returns a HTML formatted string which can be printed in the debug window using fibaro:debug();
Example
Input:
"{\"api_data\":{\"status\":\"online\",\"timestamp\":\"2019-01-18-18:01:32\",\"sensor_1\":[\"value_1\":125,\"value_2\":35],\"sensor_2\":[\"value_a\":34.5,\"value_b\":45]}}" Output:
{ "api_data" : { "status" : "online", "timestamp" : "2019-01-18-18:01:32", "sensor_1" : [ "value_1" : 125, "value_2" : 35 ], "sensor_2" : [ "value_a" : 34.5, "value_b" : 45 ] } }
50 downloads
(0 reviews)0 comments
Submitted
-

Location Tracker
By cag014
Many users are trying to use GPS feature, but the functionality and use of HC2 location data are very confusing and most of the time don't work correctly.
The major advance of this scene that there is no use of HC2 defined locations and localization.
The scene triggered by location change, which received by HC2 and tracks users' presence according to predefined places. The scene sends notification (and could announce on user location in case TTS system has been defined and set) in three conditions:
User arrived to one of the predefined places. User approaching to one of the predefined places. User leaves one of the predefined places. You can define as many favorite places as you need. For example: Shopping Mall, School and etc. to track your family members. It helps to know if your kids are actually at school, and your wife at work and not at shopping mall.
Please note that in most of the time there is a gap of few minutes between user's actually location (physical) to location received by the system. Unfortunately in some cases no update received at all. I'm using this scene for few years and still don't have full understanding how the GPS mechanism works... when, how and why the location is updated by Fibaro mobile application and I believe if the application closed on your mobile, no updates sent at all.
Based on above facts, I do not suggest to execute any actions based on user location (like to open gate, lights), but I do suggest to turn on heating system (gap of few minutes better than nothing, or you already at home and your system anyway is ON)
--=========================== USER CONFIGURABLE PARAMETERS ===============================
eMailId = {2} -- user IDs to send email. To include more users use: eMailId={2,5,20}
eMail = true -- if true, email will send
popupNote = true -- if true, popup notification will send to all users.
pushNote = true -- if true, interactive push notification will send to users, which can receive Push notifications as defined at "Access Control" panel at "Mobile devices list" section.
_TTS = false -- text to speech message. Please before setting to true, make sure to update locationTts() function with your TTS setup. Default code in function based on Text to Speech - Android phone/Tablet scene and could be downloaded from https://forum.fibaro.com/files/file/180-text-to-speech-android-phonetablet/
--list of users ID and names (the reason to include names, is because the name could be email address in the system). Set scene %%properties accordingly to IDs in list. Please update according to your system
GPSuser = {{2,"Alex"},{190, "Tammy"},{457,"Leon"}}
--list of points of interest to follow users' arrival, approaching or leave. Please update/add according to your favorite locations. Make sure that place coordinates are few times more accurate than locAcc variable below.
GPSplace = {{"Home","62.1747177;64.8820022"},{"Work","62.244312;64.842668"}}
ignoreGps = 1 -- Amount of hours to consider the location is too old and ignored. Default to ignore over one hour old user location.
locAcc = 300 -- Defined GPSplace area in meters, to assume presence in place.
distGap=150 -- Distance between current and previous locations to avoid messages in case same location received several times.
By executing the scene manually, table with users' last location and their distance from predefined places will be displayed.
Please use this feature to verify that the users' location data is receiving and updating by HC2. hasGPS column shows if user has GPS (means if location has been ever sent from this user) and how frequently GPS position is collected.
When the scene is triggered, follow information on debug window displayed:
User name, his previous and current location and timestamps. Current distance of the user from all predefined places
I hope it will do the job for you.
617 downloads
-

Z-wave monitor
By cag014
This scene monitors and catches Z-wave commands traffic between controller and devices. The data displayed to user as a table which includes total commands and their properties per device, in addition same data displayed at graphical chart and shows system activities over the time. Since Z-wave protocol is not a fastest one (in many case it's just freeze) this code helps to analyze the data and to take necessary actions to reduce overall Z-wave traffic and system load.
Scene functionality
1. This is not an auto started scene. You need to start it manually. While the scene is running, you can switch views between table/chart and monitor (follow instructions on screen).
2. User configurable parameters are:
gVar = true-- Create and use global predefined variable. The scene could work with local table as well, but by using global parameter you can keep history of the traffic. It very helpful when you're updating the system to new release, to compare Z-wave performance. In case you have decided to use global variable, copy the data to other variable to keep the history. To view data of saved variable please download and use Z-wave Viewer scene. Z-wave Viewer could be executed in parallel to Z-wave Monitor as well (when using global variable only)
logRate = 5 -- Time rate in minutes to log Z-wave activity. Used as axis X scale in charts view. Reasonable value 5 to15 minutes for 24 hours of monitoring. In case to achieve better resolution the value could be decreased down to 1 minute.
time2monitor = 6 -- Time-slot in hours to monitor z-wave traffic, after that time, table and chart will be displayed on debug window and scene will stopped. Value of 0 hours disables auto ending. User needs to stop the monitoring. If less than hour monitoring required please use decimal fraction. For example to set monitor time to 15 minutes set, time2monitor = .25
markId = "|0|0|", " Cyan" -- Devices (IDs) list and text color to display specific devices in defined color at monitor view for follow up purpose. In few cases you need to monitor specific device, so fill-in the device ID and it will be highlighted by different color from other devices.
deadOnTop = {true, "maroon"} -- Display DEAD devices on top of the monitor view list in defined text color. Since we're not always looking on the screen, so in case the system will identify dead device it will continuously display the device (in red) on debug window.
All variables below are the same for Z-wave Monitor and Z-wave Viewer
chartHeight = 100 -- Chart height in percents (%). Chart's default height fits debug window. The variable changes height of all charts (devices.scenes and events)
chartWidth = 100 -- Chart width in percents (%). Chart's default width expands according to number of samples. User could expand the width to get better detail view or to stretch to visualize the load on time axis or to take snap shot of entire time line. The variable changes width of all charts (devices.scenes and events)
topDev2disp = 6 -- Number of most active devices to display on devices chart. If set to zero chart won't be displayed.
topScene2disp= 10 -- Number of most active scenes to display on scenes chart. If set to zero chart won't be displayed.
darkSkinMode = true -- Charts display skin mode. Set false for light (white) skin.
dev2review={false,"|470|804"} -- Generate chart for every device in list of actual device readings over the monitoring time. For devices with two results (like power and energy) both reading will be displayed. On left and right sides of the chart applicable scale displayed. Please note, no chart is generated for devices like motion, door and any other sensors, which provide values of true/false.
userDev={false,"|504|_531|"} -- User defined devices and scenes IDs to generate specific combined chart. Please write underscore before scene ID |_531|
stackedChart=true -- A stacked line chart is an line chart in which lines do not overlap because they are cumulative at each point. Set to false to view standard line char. All charts except ZKG chart (events,CPU and RAM) will be displayed according to this variable.
Brief explanation what is displayed:
1. Monitor view
This snap shot includes top and dead devices marked in different color from other devices.
Two main sections in this view:
Header
1:08:07/ 6:00:00 1824 events/77 devices event/2.3s (Click Start for )
Elapsed Time/Monitoring time Number of Z-wave events/devices Z-wave traffic rate Click to switch to table/chart view
Devices list
Every device displayed at follow format -
#2/34TV509@Salon(216.7 power)
#2/34 -First number is number of events during logRate slot. Second number is total number for events so far.
TV509@Salon - device name, ID and room name
(216.7 power) - actual reading and reading property
2. Table view
total # - number of total Z-wave events on device
total % - Percentage of device's events of total system Z-wave events.
All yellow marked headers are received Z-wave properties, except two properties, dead and deadReason which are marked in red. For each device displayed the total number of this specific properties. Red marked ID, means that device was or is "dead"
By hovering mouse over device IDs, device and room names will be display (tool-tip) at popup box.
At the end displayed few extra summaries
Elapsed time and Start-End timestamps
Sample log rate as defined by user. Total samples during monitoring time
Total Z-wave events and total number of active devices
Average Z-wave traffic rate
Z-traffic range. Shows the highest and lowest z-wave activities during monitoring time.
If dead devices have found, list of them is displayed
3. Most active devices chart
This chart shows events number of most active devices ( up to number of all active devices allowed by setting topDevNum variable ) on monitoring time-line. On the right-upper corner displayed ID, name and room of the device. By hovering mouse on diagrams or legend, selected item will emphasized in bold to make the item more visible.
4. Most active scenes chart
This chart shows triggers number of most active scenes ( up to number of all triggered scenes allowed by setting topDevNum variable ) on monitoring time-line. On the right-upper corner displayed ID, name and room of the scenes. By hovering mouse on diagrams or legend, selected item will emphasized in bold to make the item more visible.
5. Review device's actual readings - (dev2review)
For devices with two results (like power and energy) both reading will be displayed. On left and right sides of the chart applicable scale displayed.
This chart most useful to identify if device configured to send reports interval at high rate and " differ in readings to send report" set to very low value.
By hovering mouse over the chart, will scale down the diagram to make visible entire range. In case the horizontal scrollbar is not in the middle of the chart , the diagram will flicker.
6. User defined combined chart
In some cases we need to inspect behavior of some devices and scene that triggered by the device. This chart shows user defined devices and scenes on monitoring time-line. On the right-upper corner displayed ID, name and room of the scenes and/or device. By hovering mouse on diagrams or legend, selected item will emphasized in bold to make the item more visible.
7. ZKG Chart View
Chart view shows Z-wave traffic and system load on time line (based on logRate value). You actually could see your smart home beating heart (like EKG). I have named as ZKG (Z-wave cardiogram). Now it's possible to see the "rush" and "quiet" hours of the system.
Chart view includes 5 diagrams displayed over time-line of monitoring period. The diagrams are:
Z-wave events Triggered scenes CPU1 percentage CPU2 percentage RAM percentage At top-right corner of the screen, displayed legend of the diagrams and colors.
Events total number in same color as a diagram line.
CPU1 min > avg < max in same color as a diagram line.
CPU2 min > avg < max in same color as a diagram line.
RAM min > avg < max in same color as a diagram line.
Triggered scenes total in same color as a diagram line.
Most triggered scene ID and scene's name in same color as a triggered scenes
In case dead devices have found during the monitoring period, the time stamp where it happened will colored red and at the top of the screen, directly above the time stamp, dead device(s) ID displayed.
Axis Y has two scales. Left scale represents occurrence numbers of Z-wave events and triggered scenes. Right scale is a percentage and it related to CPU1, CPU2 and RAM measured values.
By hovering mouse on diagrams or legend, selected item will emphasized in bold to make the item more visible.
I'm strongly advising to use global variable and to view the data using Z-wave Viewer in parallel to Z-wave Monitor
The idea behind, that you can change parameters to view different devices/scenes on the fly.
By changing user configurable parameters in Z-wave Monitor you'll need to start the scene all over again.
Note:
The debug text of these scenes is very big, so If you're using Clear Debug scene, please remove these scenes from the list.
Please let me know if extra info is required.
Please report if any bug occurred.
3,744 downloads
-

Text to Speech - Android phone/tablet
By cag014
First of all the entire credit goes to @davanha who has written this text to speech (and alarm control) APK for android and continues to maintain the code. Outstanding job.
Now, to my opinion, everyone should use this very simple and straight forward implementation. This is a great opportunity to give a voice to your home. I'm using TTS for years (UBI and EMIC solutions), but to have it on my phone at any place at home !!! sounds much better. Of course if you have tablet which runs Fibaro application and now you can make it speak... great feature for all your family, finally they can hear what you're doing. In my case the smart home is part of the family.
I know that many users use other solutions like SONOS, Google, but not one of them has this nice and convenience way to speak directly to you or any other member of your family at any place at home.
Please follow next installation steps:
1. Create TTS scene and copy the code (TTS scene v1.0-lua.txt) on your HC2.
2. Download zenitgatekeeper_0.1.651.txt to your phone or tablet. Change file extension to .apk and install the application.
3. Go to setting (initial password 1234) Application settings -> [check 'Autostart application after reboot' box] -> Http services [check all boxes on this page] see fifth screenshot-> go back till you see "Text-To-Speech mode" window (as displayed on third screenshot)
4. Usually we're cleaning our phones by killing background applications, so please lock this application on your phone.
5. To verify proper installation run on web browser follow line http://<ipadress of android device>:8080/tts=testing Your android device should now play the speech
6. You can add to play intro announcement before the message.. like "ding dong" or any other. To do so please click "Settings" button (default password to settings menu is "1234") -> Application Settings -> Http services -> Play speech on device.
7. New releases of the app are available at https://github.com/davandev/AlarmController/releases
8. Now if the setup is OK... open any code on your HC2 and execute
fibaro:startScene('ttsSceneID',{"testing my text to speech setup","<IP address of android device:8080"}) fibaro:startScene('ttsSceneID',{"testing my text to speech setup","<IP address of android device>:8080",<volume level>}) Usual volume level range is 1-15. Please notice that the volume level of your phone or tablet will be changed accordingly.
9. Another great feature of zenitgatekeeper application, it can receive "wakeup" command and it will turn on the android device screen. I've found this very useful for my tablet in living room. Till now the display was constantly on, now since I have motion sensor in the room, I'm able to turn on the display only if someone in the room. It extends my tablet display life cycle. To use wakeup just start TTS scene as shown below:
fibaro:startScene('ttsSceneID',{"wakeup","<IP address of android device:8080"}) For more information please visit this topic: https://forum.fibaro.com/topic/25004-using-an-android-device-as-a-text-to-speech-engine/
Notes:
This solution works on your local LAN- home network only. When your device is out of range, no message will be received. But when you back to your area the device connects automatically and starts to "speak". My suggestion is to assign fixed IP address to your device on your home network. Otherwise the IP address could be changed and you'll need to change it in the code. You will hear the messages even if your phone is on mute. To stop to hear the messages you need to reduce the volume or to kill the application.
Some ideas of messages could be seen on first screenshot. In addition you can install the apk application on other members of the family and you can redirect relevant messages of smart home directly to them only.
464 downloads
- cag014
- text to speech
- (and 3 more)
-
Door and window monitoring
By jwi
Scene description:
The script reads the temperature of an outdoor sensor to extend or shorten the message interval.
The status of windows and doors is checked every minute. The shortest reporting interval ist 5 minutes.
It's also possible to use the temperature of a plugin like Yahoo or Yr Weather. In this case, the variable has to look like this:
813 downloads
- monitoring
- window
- (and 1 more)
-

Universal Alarm Scene
By Sankotronic
Universal alarm v1.0
Hello everyone!
Here is one simple scene that can be used for FIRE, FLOOD or OTHER ALARM purpose. When triggered by sensor it will send you popup, push and e-mail notification. It can also activate additional alarm sounders. You can also add additional actions to turn On lights, lower blinds or whatever action you like to happen when alarm is breached and also when sensor get back to safe state.
There is no global variables needed! If you use HomeTable then you can just uncomment line where this table is read to the scene.
SCENE SETUP
First you need to decide for what you will use this scene. You can use it for FIRE ALARM or for FLOOD ALARM or for any other purpose that you can think off. Just for setup example I will show here how to set it up for FIRE alarm. Same setup can be done for FLOOD alarm.
First you need to add all your smoke detectors to scene header so that it is triggered when any of this sensors detects fire and get breached:
--[[ %% properties 96 value 128 value 605 value %% globals --]] Then you can setup devices to which you want this scene to send push notifications. As already mentioned in my other threads, to find ID of your mobile devices you can enter this link in your browser:
http://<YOUR_HC_IP>/docs/#!/iosDevices/getIosDevices
and then press on button TRY IT! You will get ID numbers of all mobile devices that you can enter here:
-- PUSH MESSAGES AND MOBILE DEVICE SETUP --------------------------------- -- define mobile devices to send push messages. Enter devices inside -- braces separated by comma local iosDeviceID = {206, 321};
Then you can setup messages text, translate it to your language:
-- PUSH MESSAGES SETUP ------------------------------------------------------ -- enter push message text for breached alarm notification local pushMessage = "WARNING! FIRE/FLOOD/OTHER ALARM BREACHED!"; -- POPUP MESSAGES SETUP ----------------------------------------------------- -- enter popup message text and button caption for breached alarm local popupMainTitle = "FIRE/FLOOD/OTHER ALARM"; local popupTimeFormat = "%H:%M:%S | %d.%m.%Y."; local popupContentTitle = "ALARM breached!"; local popupImgUrl = ""; local popupButtonCaption = "OK"; Here you can setup users that will receive e-mail message. Same as for mobile devices, you can find users ID by entering following link in your browser:
http://<YOUR_PC_IP/docs/#!/users/getUserss
and then press button TRY IT!. You will get ID numbers of all users that you can enter here:
-- E-MAIL MESSAGE SETUP ----------------------------------------------------- -- define users for which you want to receive e-mail warning. Enter users -- inside braces separated by comma local userID = {}; -- Translate this e-mail message text that will be sent to you. On this -- part scene will add which sensor was breached. local emailMessage = "Breached FIRE/FLLOD/OTHER sensor:" In above settings you can also setup first part of the e-mail message. Scene will on that part add room and name of the sensor that is breached!
If you want to activate additional sounders because fire and flood sensor sounder is not enough then you can setup here additional sounders to be activated when alarm is activated:
-- EXTRA SOUNDER SETUP ------------------------------------------------------ -- define alarm sounder ID inside braces. You can define more than one just -- separate them with comma. local sounderID = {128, 210}; And for the end, if this is not enough for you and you want more action to be executed when alarm is breached, like close water valves, close blinds or turn on some lighting then you can add that code yourself. There are three functions where you can add code:
-- EXTRA FUNCTIONS WHERE YOU CAN ADD YOUR CODE ---------------------------- -- use this function to add code that will be executed before all other -- code when sensor is breached function extraUserCodeBreachFirst() -- your code goes here end -- use this function to add code that will be executed after all other -- code when sensor is breached function extraUserCodeBreachLast() -- your code goes here end -- use this function to add code that will be executed when sensor is -- back to safe state function extraUserCodeSafe() -- your code goes here end If you want some action before notifications are send and sounders activated then you add code to function extraUserCodeBreachFirst(). If you want some action to be executed after notifications are sent and sounders activated then you add code to function extraUserCodeBreachLast(). When sensor goes back to safe state scene is activated again. It will not send any messages but will stop sounders and if you want some more action then you can add code to function extraUserCodeSafe().
So, one copy of this scene you can setup for FIRE ALARM. Another copy you can setup for FLOOD ALARM, and if you have something else then you can setup third copy for that OTHER ALARM.
Also please check this video by Mr Apple @MarcoTorino71:
NOTE!
This scene is tested on my HC2 with software 4.110 up to 4.510 by breaching FIRE & FLOOD sensors and found to work flawlessly. If you encounter any problems then please first check your settings and look for typos. If you are still unable to make it work then please send me copy of complete scene code and screenshot of debugging window to my private message and I will help you to make it work!
1,073 downloads
-
Scan variables and strings.
By cag014
Due to lack of global functions, we're adding more and more global variables. In some cases after a while we find a way to do it differently, but the global variables are still there. Usually we quite afraid to delete the variable because we're not sure if the variable is not in use somewhere in code.
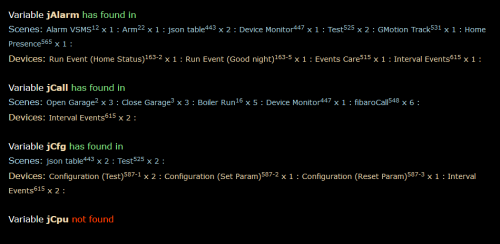
So, this code scans scenes and virtual devices and finds where the variable is in use.
Scenes displayed (blue color) by name and scene ID. Virtual devices displayed (wheat color) by name, button name, device ID and button ID. The program execution has four options:
1. Scan for all variables and display scenes and virtual devices where every variable is in use. (make sure findVar=nil and findString=nil)
2. Find where specific variable is in use by defining findVar.
3. Find where specific string (phrase) is in use by defining findString.
Some characters, called magic characters, have special meanings when used in a pattern. The magic characters are
( ) . % + - * ? [ ^ $
The character `%´ works as an escape for those magic characters. So, '%.' matches a dot; '%%' matches the character `%´ itself. You can use the escape `%´ also for all other non-alphanumeric characters. When in doubt, play safe and put an escape. For example if you're searching for string "match(" you should use "match%(".
4. To find not in use variables only. Press "start" twice within 1 second.
--================= User configurable parameters ============================
findVar = nil --------- Name of specific variable to search.
findString = nil ------ Any string to search.
--============================================================================
Notes:
In case findVar and findString are both defined, the code will scan for findString. Make sure when findVar and findString are not in use to set to nil
As usual hope it helps...
281 downloads
(0 reviews)0 comments
Updated
-

CPU & RAM monitor
By cag014
The purpose of this scene is to monitor CPU and RAM performances. In case the performance decreased it will notify the user before the system becomes unresponsive and/or stuck. During introduction of last few releases many users have an issue with CPU overloaded and system stuck, so the idea is to catch and try to solve the problem before the system doesn't respond.
The program execution has two options:
1. Stand alone using local json table
2. Using global variable for json table
Using second option you can acces to current min, max, average values of CPU and current RAM load from any other sense or virtual device.
--================= User configurable parameters ============================
gVarName = "" ---------------------- Global Predefined Variable name.
eMail = true -------------------- send eMail notification to admin only
pushNote = true -------------------- send push notification to users in push list
popupNote = true -------------------- send popup notification to all mobiles
sleepTime = 60 ---------------------- time between samples in seconds.
batchNum = 2 ----------------------- batches/readings number per sample.
batchDelay = 10 ---------------------- time between batches in seconds.
ramHi = 75 ---------------------- RAM high limit.
highLim1 = 50; highLim2 = 50 ---- CPU 1,2 highest load limit.
normLim1 = 20; normLim2 = 20 ---- CPU 1,2 normal load limit.
sample2avg1 = 20; sample2avg2 = 20 ---- CPU 1,2 number of samples to average.
--============================================================================
How it works?: (based on default values of user configurable parameters)
The program checks if any global variable defined, if not local table in use.
Every 60 seconds (sleepTime) the program will get two readings (batchNum) within 10 seconds (batchDelay) of CPU 1 and 2 load.
After 20 samples (sample2avg1/sample2avg2) average load of each CPU and RAM is calculating and in case the CPU load is over 50% (highLim1/highLim2) and/or RAM is higher than 75% (ramHi) notification will be send out by eMail, push notification and popup mobile notification. Please note that popup notification will be received by all mobiles in list of the system. If after overload the CPU average load drops below 20% (normLim1/normLim2) and/or RAM drops below 75%, user will be notified as well.
Change default values according to your needs, but please pay attention if you reduce the sleepTime and number of samples (sample2avg1/sample2avg2) , the scene could catch momentary peak of load which is not necessarily represents system performances.
239 downloads
(1 review)0 comments
Updated
-
Download Statistics
-
New reviews
-
 By Bornheim · PostedI integrated two HUE bridges in my HC3. It works perfect (and much better and more powerful then the app integrated in HC3). In particular, also sensors, temperature measures etc. are available and can be used in Scenes. However, in both cases after installing and entering the IP adress of my HUEs I had to restart the HC3 to get the authentification running. So I assume to install one has to (i) upload / install the QuickApp, (ii) enter the IP address of the HUE in the local LAN, (iii) rest
 -

-

-

-
 By Sankotronic · PostedVery useful solution to help with gradually moving from HC2 to HC3. I have tested few of the QA and used them to test some of my new solutions on HC3 keeping HC2 still having main controll of our house. Thank you @cag014 for yet another excellent solution!
 -

-

-

-
 By SmartHomeEddy · PostedGreat QuickApp and excellent configuration manual. QuickApp works smooth. Thanks!
 -

-
-
Highest Rated Submitters
No ratings this week.
No ratings this month.
No ratings this year.
-
1

-
2

-
3

-
4
-
5

-